You are using an out of date browser. It may not display this or other websites correctly.
You should upgrade or use an alternative browser.
You should upgrade or use an alternative browser.
Back to the metropolis that is Milton Keynes - oh joy - another roller coaster market ride - at least for me right now it's all theoretical as I'm just studying my plan ot attack after being destroyed beforehand. I would appreciate the image thing at Bracke - I used to know how - maybe they changed it.
Bouna giornata!
Bouna giornata!
Tubbs
To post an image
1 get chart on screen
2 press 'Print Screen' key
3 open paint package - start, programs, accessories, paint
4 when paint program has loaded click edit followed by paste. The chart should now be in the paint screen
5 save image - click file and save as. Save as a gif or ipg
6 get t2w thread on screen click on the 'reply to' button on the post you want to reply to
7 type your reply then find the gif or ipg file that you saved and open it
8 go to manage attachments, browse file and click 'upload '
9 finally click on submit reply
If you can follow that, well done!
If you have any problems with what I have described please come back to me
If anyone reading this has any comments please feel free to make them I will not be offended.
Finally I disavow all knowledge of these instructions and deny all responsibility
Good Luck Tubbs!
Regards
bracke
ftse down 20 points but appears to have stopped at 4400.
Do we see this as a buying opportunity?
Come on all you minimal and non posters this is your opportunity to have your say. If you don't its going to be a very quiet day on this thread and I'm going to get fed up talking to myself
Whilst the mully and big guns are away let the lurkers have their say
Regards
bracke
Hi Guys..just a quick hello. Had to stop posting on 3 sites simulatneously it was doing my head in. 😎 Hope you guys are ok. Still in two minds about this break out.
Here are my two possibilities...one suggest a higher low but the other a lower low? Not much help I kown. Anythoughts :?:
Here are my two possibilities...one suggest a higher low but the other a lower low? Not much help I kown. Anythoughts :?:
Attachments
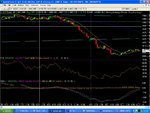
Great instructions bracke - thanks. The chart for the year so far is thus - I will also give a comparison to a previous year if anyone is interested.
As you can see for this year it's the correlation isn't amazing - this is what is giving me a bit of a headache - the fact that it's good some of the time - I'll post another year to show what I mean.
As you can see for this year it's the correlation isn't amazing - this is what is giving me a bit of a headache - the fact that it's good some of the time - I'll post another year to show what I mean.
bracke said:ftse down 20 points but appears to have stopped at 4400.
Whilst the mully and big guns are away let the lurkers have their say
Regards
bracke
Go on then 😉
The indicators looked good for an upswing just above 4400.
I don't actually trade at the moment - I am practising with a spreadbet demo account 🙄
I took a position at 4405. My guess is for a struggle up to 4435 by US open.
Apologies if this isn't technical enough, but hey I'm only a beginner! 😛
hooya
I note that when ftse got down to 4400 ( a major psychological level ) there was a large volume to drive the price up. The volume has eased with ftse at 4409 but there appears a lot of buying ready to keep it above 4400
Unless the US drops considerably it appears that it is safe for now
Regards
bracke
To explain the second chart first -
It is firstly from first trading day to last trading day of 1995 this is the candlestick part. The purple line is the averaged cumulative % return for that trading day for 20 years. So if there is a top on the purple line it means that over the last 20 years this has shown to be a time when price of FTSE has started to drop. The first post is the same bur with only the first portion of the chart and a small extension in to the next few trading days.
As I said before this is not perfect but I think it can be used as some kind of bias toward trading decisions - I really need some help from others too. I must say I have read almost all the books on trading and I feel that I'm not much closer to a decent trading ability as I was before - I have tried a hell of a lot of things though - so I suppose that can't be bad.
I hope that explanation is good enough - if not I'll elaborate.
Nick - I mean tubbs
Tubbs/nick
Thanks for the explanation
So is the object of the exercise to look at the ftse each day for a number of years and to construct a table and then a chart to show the number of occasions each day has been an up day or a down day?
If your table/chart shows a significant bias towards up or down do you attempt to find a reason why?
eg first day of the month or end of year.
Regards
bracke
Similar threads
- Replies
- 1
- Views
- 1K