FTSE100 day trading journal

ftsedaystrategy

Junior member
Messages
45
Likes
0
14 March 2013 trades.

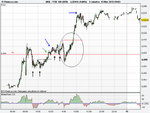
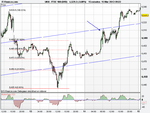
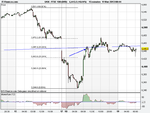
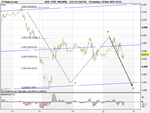
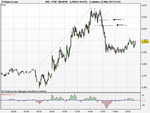
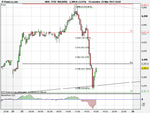
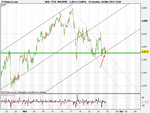
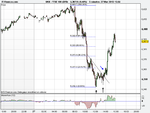
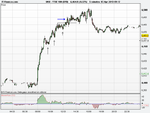
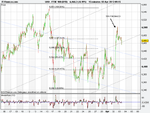
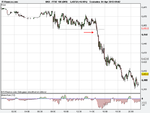
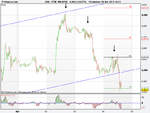
Two very important indicators that I cannot do without are the trend line on the 15 minutes chart coupled with Fibonacci retracements. The reasons why are demonstrated in today’s trading. The market’s opening is close to the trend line as displayed on the 15 min chart. To have an idea whether it is likely to turn or ignore the trend line is where we bring in Mr. Fibonacci. Taking the high of 12 March and low of 13 March we can see that the trend line is near or at the 76% Fibonacci level (blue arrow on the 15 min chart). It’s important to know that most chart packages ignores this number as one of the default Fibonacci numbers, thus it has to be done manually. With two good reasons for resistance, as expected it turns here and between 9am to 11ish am it forms a small double bottom formation. The break above the pattern is close to R1 (green arrow) so I waited to see if it will break above R1 to take a long position with the target being the 76% Fib at 6510 (blue arrow at 6510). All these played out.
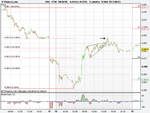
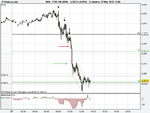
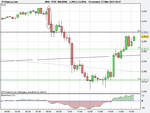
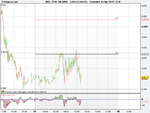
What happened after this is quite interesting. I have circled the interesting bit on the chart. After hitting my target mentioned above, again it forms two small double bottoms and it was struggling to break above as the previous two resistance factors mentioned above was holding it back. It breaks below the pattern and subsequently pulls back and closes above it. The concept of chart pattern characteristics is that if a pattern breaks in one direction and subsequently reverses and breakout in the opposite direction, then that move will be a strong one. Well, indeed it moved 16 points rapidly to my next target at 6534 which was derived from extrapolating using the Fibonacci tool and also aptly the high of 12 March. Bingo!
 

Attachments

  • 14 MAR 13.png
    14 MAR 13.png
    17.4 KB · Views: 435
  • 14 MAR.png
    14 MAR.png
    19.4 KB · Views: 470
15 March 2013

The opening candle on the 5 minutes chart at 8a.m. was hint that today is going to be a “down” day because of the down ward gap. I could not see any chart pattern, so I started investigating if there are more reasons for the index to head south today. My first port of call is the 15 minutes chart. The index was trading in the middle of my trend lines, so I check for the momentum indicator which showed a low reading despite the index hitting highs which made me look if I could see an Elliot wave pattern. The reason being it is a common characteristic when an Elliot wave pattern is completing its formation the direction of the index and momentum will be in contrasts as shown in the chart here. I have overlaid the 5 wave pattern in red and the momentum reading with a black arrow. I now have good reasons (indicators) that a short trade is on the cards today.

Now all I needed is an entry point and this came on completion of the 10am candle on the second 15 minutes chart after a convincing break of the short term upward trend line as shown (marked with green arrow). Entered short at 6506 with first target profit at S1 6495 and after moving the second trade to breakeven, closed it at 4.30p.m at 6489.
 

Attachments

  • 15  MAR 13 CHART 1.png
    15 MAR 13 CHART 1.png
    21.9 KB · Views: 489
  • 15 MAR 13 CHART 2.png
    15 MAR 13 CHART 2.png
    15.8 KB · Views: 332
18 March 2013

A non-event day. After a drop on Friday and followed by the news from Cyprus over the weekend the index opened lower than Friday’s close. There is no way to predict the direction but the usual behaviour is for it to bounce up to kiss the trend line before resuming down, if it indeed going to move further down. Moreover if my labelling of the Elliot wave is correct then an A-B-C correction is underway and it will be a down trend. Based on recent behaviour of the index I may have to eat my words, but I rather do that than taking a loss on a trade.

Well, the trend line kiss did happen which aptly was at the 50% Fibonacci retrace from Friday’s high (marked with blue arrow on the 15 minutes chart), normally two of these type of resistance is formidable so I expected it to resume its journey south from here but it had other ideas and after a small retrace, it moved up punching through the trend line. The next barrier will be the 62% Fibonacci which is also Friday’s low. I never had a trade until about 16.05 when the break above 50% Fib was also an upward break of the rising wedge pattern on the 5 minutes chart. Because the momentum reading was weak I did not expect it to move through the 62% Fib and even if it did, my second trade which would have moved to breakeven after hitting my first target (black arrow on 5 min chart) would have captured it, but this did not happen. So I had to be contended with a few pips.
 

Attachments

  • 18 MAR 13 15 MINUTES.png
    18 MAR 13 15 MINUTES.png
    17.4 KB · Views: 338
  • 18 MAR 13 5 MINUTES CHART.png
    18 MAR 13 5 MINUTES CHART.png
    18 KB · Views: 324
19 March 2013

It was one of those multiple trade days. It was all about the 5 minutes chart yesterday with the 15 minutes providing good roadmap with Fibonacci numbers.

On the 5 minutes chart, double bottom appears first (as marked) which breaks up (black arrow labelled 1) target 6454 (red arrow labelled 2) which is the high for the day since opening. Target hit and second trade was closed breakeven later on.

Double top as marked appears subsequently at the Fib 62% from Friday’s high which is also the point of yesterday’s high, so strong resistance. Break out from here (green arrow labelled 3) signalled short entry at 6460 with first target down to Fib 50% 6447(small blue horizontal line). Target hit and the bounce subsequently closed out second trade at breakeven. However this bounce proved to be a pullback and the index moved lower down hitting Fib 38% which was also close to the day’s Pivot point (6420). I did not take the trade after the pullback which the entry point would have been at 6440 (blue arrow labelled 4) that would have given me at least a further 17 pips, but hindsight is a wonderful thing in trading and in hindsight we would all be millionaires!
 

Attachments

  • 19 MAR 13 5 MIN CHART.png
    19 MAR 13 5 MIN CHART.png
    16.6 KB · Views: 525
  • 19 MAR 13 15 MIN CHART.png
    19 MAR 13 15 MIN CHART.png
    15.5 KB · Views: 408
20 March 2013

Seems like Mr. Fibonacci at 68% from Friday’s high is proving to be a formidable resistance around 6472. A superb triple top formation is for all to admire indeed. A break below 6412 will be a bearish signal in the short term and will strengthen my prediction of an A-B-C correction Elliot wave pattern and the down target will be 6360. But of course all these are theoretical and with many fundamentals in Europe currently taking place, who knows what the index might do!

Today’s early trading formed a “head and shoulder top” pattern as shown on the 5 minutes chart. The break signalled short at 6462 (arrow 1) and target profit taking at 6447 at Fib 50% (refer to 15 minutes chart). It followed the script until around mid day and it was gearing up for another drop, however not before giving us a hint in the form of a rising wedge pattern. The break happened at around 6448 level, so shorted again and target this time was 6420 just below Fib 38% at yesterday’s low. This has just been hit whilst I started writing this post.
 

Attachments

  • 20 MAR 13 15MINS.png
    20 MAR 13 15MINS.png
    17.4 KB · Views: 412
  • 20 MAR 13 5MINS.png
    20 MAR 13 5MINS.png
    16.6 KB · Views: 300
Not a very exciting trading day. The opening had a lot of promise but with major support around the 6375 area momentum was lack lustre today.

Following on from yesterday’s post, the break below 6412 happened in early trading so just one short entry at 6393 and took profit at S2 at 6383. I could have held on for another 8 pips or so near the major support, but I was not comfortable fearing a rapid bounce without warning. Can’t complain with a winning trade, it’s will always be a case of “I should have” in trading.

No other action. Seems like a broadening pattern is forming just about close of trade at 16.30 which if it does a partial decline might end up being a head and shoulder bottom, but I am not going to wait for this.
 

Attachments

  • 21 March 13 5 mins.png
    21 March 13 5 mins.png
    14.9 KB · Views: 292
Today’s expected price action..up, down or sideways? On Wednesday I wrote it may hit 6360 which it did but not during yesterday’s trading hours. For it to be a A-B-C correction of Elliot wave it has to move lower than the end of wave A which is around 6344, so to see where it possibly may come to rest (or turn) a hint can be seen from the hourly chart - the area of today’s S2 which is near a trend line and Fib 50% from mid January lows. If it is going to move down it has to break below today’s S1 which is also the end of wave A proving an area of support. It could always bounce up here or move sideways at this point. Who knows...!

Or will it move up? On opening it bounced off today’s pivot. A break above this will have to treated with caution because yesterday’s spike around 4pm is waiting as potential resistance followed by Fib 38% from 20th March high, however a good move may see it through to around 6412/16 area as this is today’s R1 and Fib 50% from 20th high.

It may well just move sideways and do nothing! We shall see...
 
Well, I did say that an up move will visit the area of today’s R1 and this is happening now as I write. I am closing my long trade now and moving my second to breakeven. If there is more strength in this move, my back up trade which is now breakeven position will capture it. The 15 minutes chart provided good indication for long entry at the 10.45 candle when it formed “belt hold” candle pattern (although this was not perfect conforming to the rules) and a “pennant” chart pattern.

A double top seems to be appearing now. Let’s see if it will break below 6400.
 
Well, it did not break below 6400 immediately following the earlier post but decided to push up a bit more above 50% Fib but didn’t quite make it to 68% and showed classic signs of turning. First it formed what seemed like “horn tops” with two spikes poking out and subsequently ended up forming “triple tops”. The rapid rise earlier also formed a channel and a break below the lower trend line and below the “triple tops” pattern (arrow 2) screamed short!

I have marked arrow 1 where an earlier short entry would have been possible (my short entry) as this is the point of break below the “horn top” pattern and also on the 15 minutes chart, the candle showed an “engulfing” pattern as circled.
 

Attachments

  • 22 Mar 13 15 mins.png
    22 Mar 13 15 mins.png
    15.9 KB · Views: 240
  • 22 Mar 13 5 mins.png
    22 Mar 13 5 mins.png
    18.1 KB · Views: 255
Today’s action is quite similar to what happened on Friday; a steep rise in the morning followed by a quick drop. The difference being the drop today comes with stronger momentum compared to that of Friday.

Traded the “3 rising valleys” pattern and entered long at green arrow. I expected it to hit R2 before turning moreover R2 was near a down sloping trend line. Everything was going well until an engulfing candle pattern emerged on the 15 minutes chart, so I decided to close out the position (red arrow) moving the back up to break even. What came next is very rewarding indeed. The morning rise formed a channel and the break below the channel strengthened by the bearish engulfing candle prompted a short entry (green arrow). First limit to take profit was set at R1 6431 and this was met very quickly. The backup is still in progress and is rebounding at the trend line heading to just around the 23% Fib from today’s high as I write this. Let’s see where it closes.
 

Attachments

  • 25 Mar 15 mins.png
    25 Mar 15 mins.png
    15.8 KB · Views: 232
  • 25 Mar 13 5 mins.png
    25 Mar 13 5 mins.png
    15.9 KB · Views: 244
The challenge in trading when the index is contemplating a move near a trend line or major support/resistance - chart patterns tend to breakout in one direction and reverse to break out in the opposite direction. The rising wedge as shown breaks down (red arrow) but since a bullish “engulfing” candle appeared before the break on the 15 min chart there was doubt whether the break was a fake? Refrained from shorting it at the break, turned out to be good decision at first as it did not only pull back, but seems to have busted the rising wedge pattern (blue arrow). Since the 15 minutes candle subsequently closed well above the trend line, I entered long expecting it will at least hit today’s pivot but it quickly turned and double busted the rising wedge pattern. Closed out longs cutting losses and re-entered short at 6377 taking profit at 6370 (black arrow).

It seems to be forming a “double bottom” pattern now. The support at around today’s low since opening is solid because it is at a major support/resistance level plus it is also not far from 62% Fib of late February lows, so a lot of problems around this area. If it breaks below overcoming these then a move below 18 March low is possible confirming my Elliot wave correction pattern.
 

Attachments

  • 26 Mar 5 mins.png
    26 Mar 5 mins.png
    15.6 KB · Views: 229
  • 26 Mar 13 15 mins.png
    26 Mar 13 15 mins.png
    26.2 KB · Views: 249
Following on from yesterday's post the "double bottom" did not confirm until after close of play.

The index rode a snow toboggan down hill today morning and duly gave us a good hint by way of "three falling peaks". Red arrow indicates a short below the break and T1 at yesterday's low 6370 level. Back up still at work.

It is currently resting around Fib 62% late Feb lows around the same place as 18 March low as mentioned yesterday.
 

Attachments

  • 27 Mar 13 5 mins.png
    27 Mar 13 5 mins.png
    15.2 KB · Views: 267
Slides down, pauses, shows its bottom and reverses whilst all the while telling us what it plans to do.

Double bottoms and also what looks like inverted "head andshoulder" - nice long trade. Currently pausing at Fib 62%.
 

Attachments

  • 27 Mar 13 5 mins 2nd.png
    27 Mar 13 5 mins 2nd.png
    17.4 KB · Views: 249
Just to add on from my earlier post. The opening candle on the 15 min chart "belt hold" pattern was a hint that it was heading for the slopes on opening, but I was not brave enough to short it just then as I needed more conformation.
 

Attachments

  • 27 Mar 13 Belt Hold candle.png
    27 Mar 13 Belt Hold candle.png
    13.6 KB · Views: 4,709
After a few days break and an overdose on Easter eggs, back to trading action yesterday whilst battling with man flu!

The index shot up and my entry point was the confirmation of “3 rising valleys”. As my entry was after it comfortably crossed above the 62% Fib the target point was 76% Fib from 15 March high to 27 March low. How beautifully it turned here.
 

Attachments

  • 2 April 13 5 mins.png
    2 April 13 5 mins.png
    15.8 KB · Views: 194
  • 2 April 13 15 mins.png
    2 April 13 15 mins.png
    27.4 KB · Views: 202
Finding it really hard to shake off this man flu!

Yesterday’s trade was easy, the break below pivot point. The chart pattern looks like a “double top” or a triple top even but these patterns form on an ascending price trend which was not the case yesterday since opening. On the basis that it tested the pivot point three times since opening in itself indicates a break would signal a drop, so discretion is the way of valour and it paid off.
 

Attachments

  • 3 April 13 5 mins.png
    3 April 13 5 mins.png
    15.7 KB · Views: 188
One of the reason I hate trading any forms of triangles! Very fickle minded breaks one direction and reverses to the other. Understanding chart pattern characteristics is vital because a false break and subsequent opposite move indicates a good second move.

As many would have been cautious today due to BoE and Draghi announcements, it
is worth remembering that news always follows the market. Don’t ask me why but that’s how it is.
 

Attachments

  • 4 April 13 5 mins.png
    4 April 13 5 mins.png
    16.5 KB · Views: 198
It’s not uncommon to find two patterns to confirm which gives more reason to take the trade.

On the 15 min chart “3 falling peaks” forms and interestingly the confirmation is at the up sloping trend line around the 6390 mark. Following on from my earlier post i.e. a frustrating bust of the ascending triangle where I had to cut my losses, as mentioned it reversed. So, sitting on my hands waiting for a break below 6390? Well, well like I used to say the index always gives a hint what it plans to do if you know how to read the signs. First, “3 falling peaks”. Second, busting of the ascending triangle and the final nail was the break below the trend line. So there you go. T1 was at S1 and I still have my back up in play at breakeven – so I have a free ride on this and as I write it seems to be heading for S2.

It’s time for some lemsip, hope that will do the trick in kicking the damn cold!:eek:
 

Attachments

  • 4 April 13 15 mins.png
    4 April 13 15 mins.png
    16.3 KB · Views: 200
Top