FTSE100 day trading journal

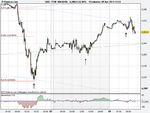
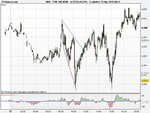
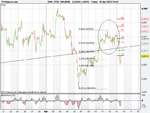
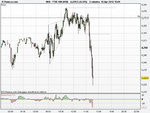
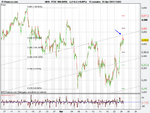
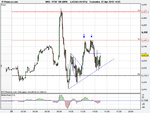
No trades last Friday as my nemesis the man flu reared its ugly head with a vengeance and I was resigned to staying in bed! I missed a good move down with the index breaking below my lower trend line on the hourly chart. Never mind..

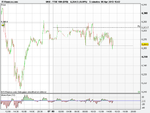
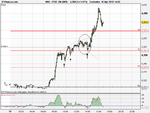
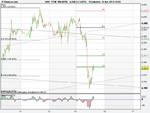
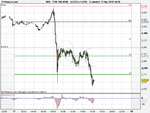
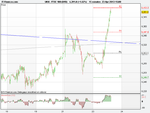
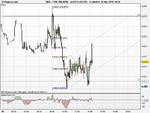
Side ranging today with just one small trade with the break of the rising wedge taking profit at 6263 which is proving to be support of the day.
 

Attachments

  • 8 April 13 5 mins.png
    8 April 13 5 mins.png
    16.9 KB · Views: 214
  • 8 April 13 1 hour.png
    8 April 13 1 hour.png
    26.2 KB · Views: 157
It is proving to be undecided thus far today. On the 15 minutes chart what appears to be “3 rising valleys” confirmed up but because of the overhead trend line, I waited to see if there will be a throw back and a subsequently close above the immediate previous high. Didn’t quite happen and a rising wedge formed breaking down. Did not short as I was not sure if this break could be a continuation of the throw back and it would resume up? It lost its grip and slid down further to the point of the start of wedge pattern and a bit further. Now resting just above today’s pivot and 23% Fib of Friday’s low. A break of this could see it go down to S1 the next support level and also 50% Fib from Friday’s low. A break above 6310 could see it test today’s high at 6325 region.
 

Attachments

  • 9 April 13 15 mins.png
    9 April 13 15 mins.png
    17.2 KB · Views: 177
  • 9 April 13 5 mins.png
    9 April 13 5 mins.png
    15.9 KB · Views: 213
Yesterday was a frustrating day as per my trading style. Following the post it attempted to break below the pivot and it did but the support was holding it and it kept bouncing up between 6310 area and pivot. Eventually a good break above 6310 came after close of play at 17.30.

As I write today it is contemplating at the upper trend line on the 1 hour chart. Is this just a trend line kiss before resuming down or is it going to power up?
 
It did move up above the 1 hour chart trend line whilst playing some tricks with multiple chart patterns and resulted in me trading a false breakout but had to close (cut losses) and re enter in the opposite direction when the charts said so.

On the 5 min chart; first a rising wedge breaks down and also below the immediate support around the 6359 mark. It also looked like a small “double top” (circled) and interestingly also the point of 50% Fib from 2 April high. This didn’t go well and it bounced off R2 almost immediately and resumed up. Then it formed a “broadening” pattern. The 14.45 candle signalled break above this pattern and the shape of the candle “bearish belt hold” with “3 rising valleys” plus trading activity above the trend lines on the 15minutes and 1 hour chart had to be a long trade. Re entered long with T1 at 62% Fib from 2 April high. Nicely worked out and it is backing off just about at this point.
 

Attachments

  • 10 April 13.png
    10 April 13.png
    16.8 KB · Views: 202
Symmetrical triangle and what looks like a very ugly triple top. The break below the triangle moved to 62% Fib of 2 April high and bounced here which is also the area of support from today’s high just after opening. Did not trade the triangle as my T1 would have been at the base of the triangle which is close to the break point, so I was not happy with the risk/reward of this trade. Instead I waited and traded the “triple top” when it broke below 6399. Absolutely no momentum to carry it down and with what shaping up to be an ugly double bottom, closed it at break even.
 

Attachments

  • 11 April 13 5mins.png
    11 April 13 5mins.png
    14.5 KB · Views: 202
Closing the earlier trade at breakeven was a good move. Look what happened! The “ugly double bottom” also formed a small channel and a break above the channel had 3 signals for a long trade including busting of the symmetrical triangle.
 

Attachments

  • 11 April 13 5min v2.png
    11 April 13 5min v2.png
    16.1 KB · Views: 209
I will quickly cover Friday’s action before touching on today’s. Some interesting developments around the trend line on Friday with some rather large swings. The 8.15am candle on the 15 minutes chart was the clue that a drop was a possibility as it displayed two candle patterns in one. “Bearish belt hold” and “engulfing”. As I rarely trade just going by one signal so for me there was no trade. It did fall and bounce off Fib 23% of 5 April low. A descending broadening pattern formed as shown on the 5 minutes chart. A pull back below a trend line is what you would expect it to do, so there were good reasons for me to go long at the break of the broadening pattern with T1 at PIVOT 6400 mark. It is always tricky trading at around trend lines and it did throw back which got me a little nervous before hitting my target and plunging back down to the support zone at 6367.

Ok, coming to today’s. On the 1 hour chart “head and shoulder top” pattern was taking shape on Friday and I had my sight firmly for a break below the pattern and more importantly below Friday’s support zone. Played out nicely, T1 at today’s S2. The crossing point of trend lines is normally an area of solid support/resistance in any market and the FTSE is no different and this is where it bounced earlier today. Zig zag a little forming an ascending triangle pattern before breaking up and hitting S3 being my T1 for the long trade.
 

Attachments

  • 12 April 5 mins.png
    12 April 5 mins.png
    18.1 KB · Views: 212
  • 15 April 13 15 minutes.png
    15 April 13 15 minutes.png
    16.8 KB · Views: 210
  • 12 April 13 1 hour.png
    12 April 13 1 hour.png
    20.4 KB · Views: 206
An example of why trend lines coupled with Fibonacci can be a powerful tool. The sell off yesterday moved below the trend line bounced to kiss it (as I have mentioned previously this is a typical characteristic) and resumes down. A short trade in need of a target and look how beautifully it reverses at the trend line and 76% Fib. A thing of beauty!
 

Attachments

  • 15 April 13 15 mins 2nd.png
    15 April 13 15 mins 2nd.png
    21 KB · Views: 201
Trade just closed and the chart is self explanatory I believe. Target 6317 hit.
 

Attachments

  • 16 April 13 5 mins.png
    16 April 13 5 mins.png
    18.3 KB · Views: 197
Quite an eventful day with the morning news sending the index south. After the initial drop it was side ranging and formed a few patterns worthy of quick trades. From left to right; a mini double top (circled), followed by falling wedge and finally a broadening pattern. One provided a false break failing to reach the target - the mini double top circled but the falling wedge saved the day when this breakout reversed. The winner of the day was of course the broadening pattern which precisely hit the target just few moments ago at 6230.
 

Attachments

  • 17 April 13 5 mins.png
    17 April 13 5 mins.png
    16.7 KB · Views: 215
I have mentioned more than once that busting patterns are a gift and again today it is clearly demonstrated why this is the case. See the chart.
 

Attachments

  • 18 April 13 5 mins.png
    18 April 13 5 mins.png
    15.8 KB · Views: 191
Friday’s trade – first one was not great and the second was decent. Normally I do not use trend lines on the 5 minutes chart but I found this hard to ignore. The first trade was the break above the trend line with a small “double bottom” pattern preceding it. The target was 6300 area with 38% Fib of 11 April high and also an area of support from trading activity earlier in the week. Nothing happened and it stalled, forming double tops, triple tops or whatever tops you can call it and plunged down straight to the bottom trend line. “Head and shoulder” bottom formed at the bounce phase but I was not interested to trade this as the break was close to the upper trend line and the day’s high.
 

Attachments

  • 19 April 13 5 mins.png
    19 April 13 5 mins.png
    19.2 KB · Views: 187
The index has a rocket up it’s rear today. The ignition was the break above the ugly double bottom on the 15 min chart just above today’s pivot point. First target was at R1 also 62% Fib of 11 April high. Back up trade still in play.
 

Attachments

  • 23 April 13 15 mins.png
    23 April 13 15 mins.png
    15.7 KB · Views: 196
Trade closed few minutes ago break of the falling wedge with T1 at 6423.

Just to vent out my frustration of missing a decent trade in the morning – after yesterday’s trip to the moon by the index, it was interesting to see it stalling at my upper trend line on the 15 min chart which is the area of 62% Fib of 15 March high. The trend line stopped the morning rapid rise in its tracks and formed an “evening doji star” candle pattern on the 5 min chart which is a bearish reversal indication and works 71% of the time. A short here would have T1 at 6420 i.e. the highest point of yesterday and today’s 38% Fib low to high. Did I short it – NO! Why? Don’t know!
 

Attachments

  • 24 April 13 5 mins.png
    24 April 13 5 mins.png
    16.6 KB · Views: 187
  • 24 April 13 15 mins.png
    24 April 13 15 mins.png
    25.9 KB · Views: 207
Round two for the day. “Head and shoulder bottom” T1 at 6435 just hit.
 

Attachments

  • 24 April 13 5 mins 2nd.png
    24 April 13 5 mins 2nd.png
    16.4 KB · Views: 163
Two days in a trot I missed trading candle patterns when it was screaming sell! That’s the price of getting to your desk late. Yesterday’s excuse was stupidity and today’s – nursery run! The little ones have a weekend of studying chart and candle patterns! That’ll teach them to gobble up their breakfast when I tell them to do so!

Following the opening today morning it stopped at 76% Fib of 15 March high at the point of today’s R2 with the candle pattern “dark cloud cover” which has 60% chance of a reversal - 3 indicators flashing sell! T1 would have been R1 at 6444.
 

Attachments

  • 25 April 13 5 mins.png
    25 April 13 5 mins.png
    14.4 KB · Views: 158
  • 25 April 13 15mins.png
    25 April 13 15mins.png
    26.2 KB · Views: 195
Ok, progress update. After the morning decline, a “broadening descending wedge” formed with a clean upwards break prompting a buy. Obvious T1 was at R1 which is also the overhead trend line on the 15 min chart. It followed the script and subsequently formed a mini double top. The break below triggered a sell where I had my target at today’s pivot but I don’t quite like the resistance it is facing now so have moved the position to breakeven. Let’s see what happens.

It has to negotiate quite a few obstacles if it is to head down; first the point of today’s low of 6410 is also the 23% Fib of recent lows from 18 March, so I will be surprised to see this being breached at least for today but I could be wrong. Then we have another area of support around the 6400 thanks to the trading activities of the previous two days and if it’s weak enough to overcome these then we have our good friend Mr. Fibonacci waiting with his 38% mark precisely at Tuesday’s spike around the 6373 area.

Exciting times ahead!
 

Attachments

  • 25 April 13 2nd.png
    25 April 13 2nd.png
    17 KB · Views: 181
Quick update on yesterday - after moving the mini double top trade to break even, it was closed out and interestingly it busted the pattern and moved up. I was not keen to trade this busting pattern due to the overhead resistance it faced i.e. R1, upper trend line on the channel formation, 62% Fib and 76% Fib. With T1 at 6463 it had to overcome huge turbulence to reach the destination.

It’s been a boring Friday. No trades – a triangle appeared on the 5 mins chart but the breakout was close to the base so avoided this and the subsequent spike became a channel, avoiding the busting formation of the triangle which promptly bounced off the lower channel line. The channel itself doesn’t look great with just two touches of the lower trend line after which the index poked below it for a bit. Judging by the way it is moving today, I can’t see a good pattern forming.

Just to recap what was mentioned yesterday, the area of 6400 providing good support which is the case today. It has tested this twice, so it will be interesting to see this point being breached.

Wish you all a good weekend.
 

Attachments

  • 26 April 13 5 mins.png
    26 April 13 5 mins.png
    19.1 KB · Views: 210
Top