StephenMcCreedy
Active member
- Messages
- 168
- Likes
- 3
if possible can you post a chart of that
if possible can you post a chart of that
I assume you mean Jacko, unfortunately it seems he was a bit of a fraud and has since disappeared with a lot of money. I didnt follow his methods but I have heard that it was all hype and didnt really work well in practice.
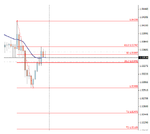
thanks simon i'm going to use that today and see how it looks. i follow a ftse guy who uses the 61.8% as you do to find the extension with great results. i'm yet to find it easy to spot but it works well when you get it down to an art.