You are using an out of date browser. It may not display this or other websites correctly.
You should upgrade or use an alternative browser.
You should upgrade or use an alternative browser.
FetteredChinos
Veteren member
- Messages
- 3,897
- Likes
- 40
nicely done jonny. off we go again.
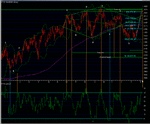
chart to follow 🙂
chart to follow 🙂
FetteredChinos
Veteren member
- Messages
- 3,897
- Likes
- 40
FetteredChinos
Veteren member
- Messages
- 3,897
- Likes
- 40
its close isnt it. longer term pattern looks bullish doesnt it. i was just thinking of a retracement lasting a few days to give everyone time to hop on again perhaps?
FetteredChinos
I realise I have the benefit of hindsight. Your sell set up was fine for a day trade to overnight on the divergence and produced around 20 points. However divergence signals often require you to take positions against the trend. Had the 30, 60 minute or daily been confirming divergence then I would agree. Without it all you had was a day trade allowing for a very short trend to run its course to the following morning.
I think there is a good chance that when this recent trend from below 4300 stops to catch its breath there will eventually be a few days selling, its just a matter of timing and a break of the 60 minute trend may prove a better gauge than the 15 minute chart IMHO.
peterpr
Established member
- Messages
- 609
- Likes
- 7
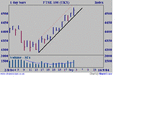
Not sure anyone is interested in the footsie any more but here goes anyway:
There's something of a battle royale going on this morning between bulls and bears. Haven,t seen such large swings on the 10-15 minute chart for over 6 months now.
If movement in successive highs and lows has any validity on such a timescale, the bulls seem to be ahead on points right now with 4 successive higher lows and 4 successive higher highs - only by a whisker though and momentum remains downside. Also the 30 min and hourly chart tells a slightly different story - bears ahead on points!.
A sixth successive higher close is a pretty rare event, so my money is with the bears (again!). Looking for a lower close if only for a respite.
peterpr said:Not sure anyone is interested in the footsie any more but here goes anyway:
There's something of a battle royale going on this morning between bulls and bears. Haven,t seen such large swings on the 10-15 minute chart for over 6 months now.
If movement in successive highs and lows has any validity on such a timescale, the bulls seem to be ahead on points right now with 4 successive higher lows and 4 successive higher highs - only by a whisker though and momentum remains downside. Also the 30 min and hourly chart tells a slightly different story - bears ahead on points!.
A sixth successive higher close is a pretty rare event, so my money is with the bears (again!). Looking for a lower close if only for a respite.
Hello peterpr
Perhaps we are wary of the ftse direction over the coming weeks.
The bulls have been in charge over the past 3 weeks and we had 7 succesive higher closes which started on 19/08. From the 16/08 to 07/09 14 higher closes and 2 lower closes with a total change of +264. Over the same period the dow has risen 518.
Can it be maintained or push higher until after the November election. If it can what happens after that, does the US just keep printing money to fund itself or not.
Regards
bracke
FetteredChinos
Veteren member
- Messages
- 3,897
- Likes
- 40
barjon
Legendary member
- Messages
- 10,752
- Likes
- 1,863
just a quickie
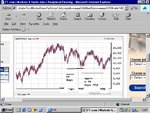
in the bull run ftse has made 3 fast upruns of between 6% and 7% (ignoring the first one of 17%) and on each occasion it retraced by more than 50% in half the time taken by the up move.
We're at about a 6% rise now and interestingly 7% takes us to about the 4600 April high. A nice double top in prospect? You beary boys may yet be right, but I hope you've been making hay while the up sun shines.
(Of course, it may take out the highs and keep going!!!!!)
FC
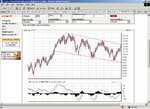
I attach the dow chart with some poorly added notes
The time between the lows is approx 60 days and 90 days.
If the dow is at its interim high and the pattern is followed, the low will be reached at earliest in early November or early December.
I don't know the date of the election but I would have thought every effort will be made by Mr Bush & Co to keep it up until early December.
Forgot to add chart, it is in next post.
Regards
bracke
FetteredChinos
Veteren member
- Messages
- 3,897
- Likes
- 40
november 2nd is the us election i believe
55 days from now..
is that close enough in your window??
can you tell im bearish lol 🙂
55 days from now..
is that close enough in your window??
can you tell im bearish lol 🙂
barjon said:just a quickie
in the bull run ftse has made 3 fast upruns of between 6% and 7% (ignoring the first one of 17%) and on each occasion it retraced by more than 50% in half the time taken by the up move.
We're at about a 6% rise now and interestingly 7% takes us to about the 4600 April high. A nice double top in prospect? You beary boys may yet be right, but I hope you've been making hay while the up sun shines.
(Of course, it may take out the highs and keep going!!!!!)
I have the highest April closing price at 4576 on 27/04 and highest intraday of 4602 on 23/04. ftse then declined to a closing low of 4287 and intraday low of 4283 on 26 07.
So are we expecting a repeat.
Comment such as your last one in the brackets are not welcome by us beary boys and in some circles are regarded as blasphemy or worse.
Regards
bracke
FetteredChinos said:november 2nd is the us election i believe
55 days from now..
is that close enough in your window??
can you tell im bearish lol 🙂
Based on the chart I think you may be pushing it a little for 9500 by 02/11.
But we live in troubled times, anything can happen and quite often does.
You bearish - does a bear .... in the woods.
Regards
bracke
FetteredChinos
Veteren member
- Messages
- 3,897
- Likes
- 40
lets get 'im bracke 🙂
ive got some concrete shoes that might just fit him 🙂
ive got some concrete shoes that might just fit him 🙂
FetteredChinos
Veteren member
- Messages
- 3,897
- Likes
- 40
bracke said:You bearish - does a bear .... in the woods.
isnt the phrase "does the Pope s*** in the woods" ?
:cheesy:
FetteredChinos said:isnt the phrase "does the Pope s*** in the woods" ?
:cheesy:
I'd heard the bear version, seems more likely, as what would the Pope be doing in the woods.
Just an aside and not wanting to offend anyone but the last time I saw the Pope I doubt he could get anywhere near a wood unless someone carried him.
Regards
bracke
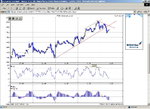
Here's the Advancing Issues Indicator (AIM) again, as featured in the August TASC. It measures stocks which have advanced over the previous 20 days, and which are still advancing on a daily basis. Since I last posted I've increased the nos of FTSE 100 stocks from 20 to the top 40 by market cap. Yesterday it reached a level of 39 and turned down. As the chart shows, turns from above the 80% level (32) and up from below the 20% level (8) have been pretty reliable in the last year. Even in a long uptrend it usually marks a pause in the trend.
The news yesterday also said that the FTSE100 had risen for 14 of the last 16 days - a great contra indication - the announcement, that is, rather than the fact 🙂
The news yesterday also said that the FTSE100 had risen for 14 of the last 16 days - a great contra indication - the announcement, that is, rather than the fact 🙂
Attachments
Similar threads
- Replies
- 23
- Views
- 13K
- Replies
- 4
- Views
- 3K