FTSE 100 - May

"has been to either hold a position overnight or take a position after hours"

Its obviously looks that way when you look at the charts but think it is dangerous ground. You still have to have signals and you are more likely to get stopped out over night because of the US imo. There are still plenty of points to be made intraday...so far abotu 15 points off the low
 
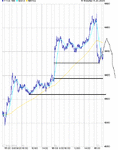
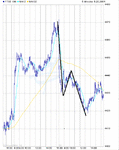
I am looking for an ABC pattern to-day. (based on assumption that FTSE correcting move from Monday's low.

Monday's Low 4363
Wednesday's peak 4472

38% retracement 4430
50% retracement 4418
62% retracement 4405


The first low appears to have bounced off the 38% fib.

Sorry about my paint box drawing ability!!!
 

Attachments

  • chart.gif
    chart.gif
    17.2 KB · Views: 176
Last edited:
sounds good to me...and if thats the case I have a good arguement saying that the low of day will be made nearer the close so might spend most the day making a slow b wave with c starting this afternoon?

an if we can make it to 403 it will close both of the recent up gaps
 
i did just have an after thought. assuming that 'c' is at minimum = to 'a , b shoudln't go up past 45..however if 'c' is any longer which it usually is (1.38 or 1.62 times a) then it could go back into the 60s first.

Just a thought?
 
Last edited:
and ully there is always the possibility that we havent even completed a yet :)
 
Yes, i had problems with D4F earlier. I sent them an email - got a reply saying it would be 30mins until up and running again but the next minute i got back in.
 
barjon,

heres another attempt at post'g chart of vol -

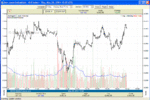
real time vol of dow -none available for ftse. looks like vol can confirm direction
 

Attachments

  • dow real time vol.GIF
    dow real time vol.GIF
    92.1 KB · Views: 173
clin

mmm - interesting, was it fin who (earlier) drew attention to skim's post (on another thread) to help identify whether the volume is down to bulls or bears?

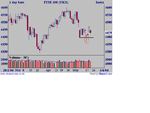
Eureka :!: Sharescope seem to have recognised opening gaps in ftse at last (but only for the last week or so which makes the chart look very odd). That makes Monday's candle a long legged doji star and a good reversal indicator in its own right (quite apart from that volume analysis bit). Not sure what to make of today's action....it did close the rising gap (?) but there was no follow through which is a bit bullish? On the other hand (there's always that other hand :LOL: ) a good rise followed immediately by a good drop suggests still plenty of selling around? Wait an see as usual.
 

Attachments

  • ftseW.gif
    ftseW.gif
    12.3 KB · Views: 156
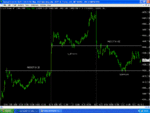
Nice example of support/resistance switch today.

Playing the second bounce would have produced some nice trades.
 

Attachments

  • untitled.GIF
    untitled.GIF
    73.4 KB · Views: 209
Morning all,

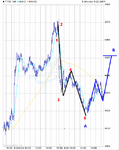
Well did we get an ABC pattern yesterday?

I have included my interpretation on the chart.

Global backdrop is mixed.

Wall Street has yet to make up its mind as to whether (SP500)
is going to respect its 200 day MA, or whether its going to panic
and fall through, triggering momentum sellers.

That's suggests to me that FTSE100 may not be able
to go too far until US situation resolved.

However:
Tokyo closed up 1.92% this morning.

Re FTSE yesterday. I note that volumes on individual stocks,
I follow, were much, much lower on the retreat yesterday
compared to Wednesday advance.
Looks like testing of the market.
Successful testing needs to see lower volume on a retreat.
So I am reading that as +ve for FTSE100.

FTSE100 cash hit its 50% retracement 4419
and bounced yesterday.
Again that is potentially +ve.

D4F calling +10
 

Attachments

  • chart.gif
    chart.gif
    21.3 KB · Views: 155
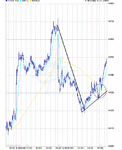
Morning. had a day off yesterday...sorry to use your chart Mully but this is what I am thinking. Currently long as a stop is not to far away
 

Attachments

  • chart1111.gif
    chart1111.gif
    22.2 KB · Views: 189
Just had to pop out.

Did you all see the test, first thing, of the 1 day SMA, which held providing a low risk entry.

Now approaching last week's "ceiling" at 4454 again and Hooya implied target on his chart
 

Attachments

  • chart.gif
    chart.gif
    21 KB · Views: 161
assuming this is an abc this is where I expect it to go. closing the gaps at 403 and 414

edit: might not be finished yet though
 

Attachments

  • gootgt.GIF
    gootgt.GIF
    42.2 KB · Views: 177
well I have us in 5 of c up so anything is possible. Be suroriced if it goes that high but wont mind :)
 
Top