FTSE 100 - May

not gems - but you do have to watch volume with candlestick patterns.

I will be looking at that Tom Ord volume decrease tests of support/resistance I mentioned first off though. Typical that the first example I came across after reading the article has worked so well - it'll probably be the only time :LOL:
 
Barjon,

Sounds like the Wyckoff method of trading markets.

Moves need to be confirmed by volume.

The level of volume is indictative of trader's willingness to deal

Low volume suggests reduced conviction (to a price move), more uncertainty about the future direction of the market.

High volume suggests greater conviction (to a price move), a high degree of confidence in the future direction of the market.

Volume is taken as a proxy for trader sentiment.

Re his comment on Support/Resistance

Old S/R tested with reduced volume suggests less conviction. S/R valid?
greater volume suggests more conviction. S/R vulnerable
 
you might find it on their website www.traders.com - it was in the May issue of Stocks&Commodities and the article is Price+Volume=Price Movement by Tim Ord (Yes Mully it is based on Wyckoff)
 
ps: there was another good piece on volume in Sep-Oct 2003 Traders magazine (assuming you've been keeping your free copies!!!) entitled Volume:the mystery.
 
dammit, just up and running again and now my better half wants me to cut down a tree - ah well duty calls.

good trading guys cya
 
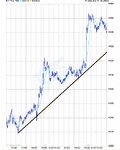
Is this the pause that refreshes?

Breakline still intact

1 day SMA still rising
 

Attachments

  • chart.gif
    chart.gif
    19.7 KB · Views: 202
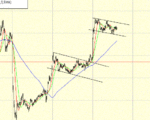
15 point pullback after a 40 point run feels positive.

Are we just completing the second test of 4435 to-day?

Short term the 4454 ceiling may limit move.
 
a possibility that could target the 98 gap???
will have to see where it goes from here.
 

Attachments

  • great.GIF
    great.GIF
    38.7 KB · Views: 196
Hooya,

Thinking the same thing. Would like to see one more bounce of the bottom channel b4 take off
 
ydid you see that..break out retest of the top line of the flag and away. Now it is safe to move up the stops etc (in the head at least)..exactly the same pattern as yesterdays bigger one imo
 
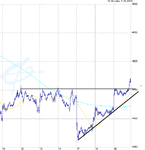
FTSE100 continues to act well.

:arrowu: 1 day SMA
:arrowu: Breakline

Market did pay respect to "ceiling" around 4454.

We may see test of the break just to check its validity.

SP500 currently testing its own "ceiling" established last week.
 

Attachments

  • chart.gif
    chart.gif
    14 KB · Views: 167
Last edited:
i've taking the pennies on the FTSE its been a good two days..and cant be sure US is finished yet. The FTSE imo can carry on falling or gap up tomorrow so think i will stay flat for a bit
 
Top