FTSE 100 - May

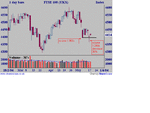
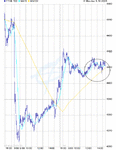
FTSE 100 flirting with its 1 day SMA.

Oil stocks masking attempts at building a positive picture.

Both BP and Shell knocking over 0.3% of Footsie move up +0.2% (ie it could be up 0.5%) compared to F250 +0.97%

Watch FTSE 250. It beginning to show that strength.
 

Attachments

  • chart.gif
    chart.gif
    19.9 KB · Views: 168
Last edited:
evenin' all (or one for you early birds tomorrow)

Back on line at last. Won't bore you with candlesticks for a change, instead an interesting piece in May TAofS&C about price/volume by Tim Ord. One bit caught my eye - when price tests a previous low on an 8% or more decrease in volume and closes back above the previous low it implies a reversal. So far so good :)

ps: is it just me (sans broadband) or do the pages take an age to load on the revamped site?

Good trading.
 

Attachments

  • ftset.gif
    ftset.gif
    12.9 KB · Views: 206
Not a great trending day.
Yes, markets had rallied from the lows first thing Monday , implying all to go for on Tuesday
and yes, Crude oil prices were easing back (June Crude Oil fell $1.01)

However, to-day appeared to lack any real conviction, (unfortunately replicated by the US equity markets as well to-night.) D4F FTSE 100 quote is 10 points below London's close.

The heavy weight oils put a brake on the FTSE 100 performance.
The less distorted FTSE250 rose over 1%.

In terms of the charts:
the supporting breakline is still positive :arrowu:
the 1 day SMA held the FTSE100 all day and is rising :arrowu:

However, there appears some resistance at 4422, which held the FTSE100 twice. :arrowd:

In conclusion, the chart still paint a positive picture, even if there appears no conviction to this move.
A break above 4422 would be positive,
but the D4F quote suggests an early test of the rising SMA and even the breakline..
 

Attachments

  • chart.gif
    chart.gif
    20.3 KB · Views: 160
Last edited:
Early indications(D4F) are for a 18 point gain this morning.

Japan (Nikkei) rose 2.4% to 10967.74
 
FTSE100 rapidly approaching the ceiling established last week 4554.

The MACD divergence charts appear to be working.
 

Attachments

  • chart.gif
    chart.gif
    13.4 KB · Views: 156
Nah, don't think so mate. Too much messingn about between break of channel and target price. Also not the tight channeling that you associate with flags. More of a falling wedge...hence the failed retest of the top yesterday. imho
 
worth noting for the month a head

gaps to the downside 4309,4359, 4403,4414
to the upside 4498 only (i think)
 
flags/penants often test the channel break out especially on the FTSE.. you might neesd to stick it on a longer time frame if you cant see it
 
I have got a fib at 4453.9 and also see the resistance as mentioned above..
No predictions though
 
I would suggest noting it for the future as that is a pretty common shape of a flag pattern over a few days on the FTSE and this time was worth 40 points and a possible shorting opportunity. Obviously in quicker times i.e intraday you will see more a pole flag pole shape but in loner time frames all the moves in the pattern are exaggerated. but will agree to disagree.
 
no-one's picked up on price/volume post (703 previous page) - anyone use such a technique?
 
unfortunately volume is not my cup of tea. Use it in respects of a new high on lower volume or visa versa etc but not really on the FTSE. I guess longer term traders might

resckon Mully would know though???
 
Hi Barjon,

Good to have you back on line.

I don't really use volume in my trading so couldn't really comment though seems fair enough...also noted that it was the lowest volume day yesterday on NYSE after Christmas last year.
 
mmm, some of it's worth a look. eg: a down during the day which closes on the highs on low volume is a pretty reliable indication of a good up move the next day.
 
Thank you to everyone who responded, some directly. My initial reaction after my call to my broker was that these were not the ordinary options e.g. some new instrument. that I was used to seeing on LIFFE. This has given me yet a new slant on options trading which I had not considered in 10 years of casual trading, not being exercised. I missed out yesterday but at least I didn't dive in without understanding my risk position. I would also like to say how refreshing it is that there are guys & gals out there who are prepared to spend time and effort to help others like me.
 
Top