You are using an out of date browser. It may not display this or other websites correctly.
You should upgrade or use an alternative browser.
You should upgrade or use an alternative browser.
Good morning All,
Some thoughts on the FTSE 100.
Looking at a weekly chart price finished down just on 10 points with the low breaking previous support only to recover just as quick. Same with the high--reverse just as quickly as it made it.
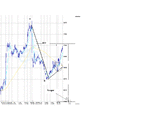
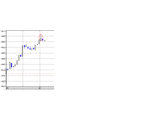
On the attached chart you note the 50% level from Mar 24 low to April 23 high is 4446 which is what this market has rotated around for 9 sessions now. Also the above dates was 30 days from low to high. We have gone another 30 days from the high to yesterday ( today really--being the trading day +- 2 days) and have not retraced the same distance--almost 78.6%. My point being, if a down move is going to develop it needs to get a move on otherwise we could just see a sideways pattern unfold for the next 30-45 days.
The move up into last Wed high of 4472 left a little bit of space from the swing low of April 30 low. (See blue arrows)
50% retracement of 4601.6 - 4363 = 4482ish right in the middle of this.
If and when last Wed high gets broken (it may offer some resistance) April 30th's low of 4490ish could through up some resistance. Also 61.8% Ret of the May 5th high toMay 17 low is 4494
And of course the round figure of 4500. So a bit of resistance there is price and Fib retracements. I guess depending on the strength of any move through these figures on how far and fast the market goes.
The previous rally from Apr 30th low to May 5th high was 84 points. May 17 low to May 19 high beat this in price ( 109 point Ret) and did it in the same time ie momentum strength.
A couple of closes above/below 4446 should clear up direction in my mind.
Your thoughts / comments ?
regards,
KJH
Attachments
Another week of range trading for the UK equity market.
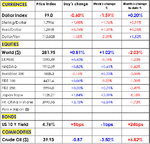
This tells us that there is no dominant/strong view in the market. Oil remains a major talking point. OPEC, this weekend, seemed not to immediately back Saudi Arabia’s call to raise production. The price fell 87cents on Friday to $39.93.
US long term interest rates remain above 4.75%
However, IMHO the problem lies in the US equity markets having yet to show a convincing bounce off their respective 200 day MAs. Until there is clear leadership from the US it is probability unrealistic to expect UK equity markets to perform.
Note the modest volumes being recorded on both sides of the Atlantic.
This appears to indicate uncertainty about the future direction of the market. However, it should also should warn us to be on guard for a sudden breakout in to a trend mode by the markets.
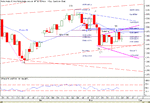
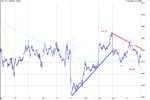
Looking at the FTSE100, there has been a clear up move since Monday (4363 to 4472.) Since then, the FTSE 100 appears to have traced out an ABC pattern, which has retraced 50% of the move to 4472. (that usually suggests strength)
Issue is whether the move since Monday 17th is the start of a new impulse move or just a correction to the major down move from 4602.
D4F quoting a 6 point loss on the open.
FTSE100 has a number of companies reporting:
Monday: EMI
Tuesday: Vodafone, Marks & Spencer, GUS
Wednesday: ICI (AGM)
Thursday: Boots, Barclays(trading update)
Friday: HSBC (AGM),
Attachments
Finirama said:Nice one Hooya...you never fail to impress me with your wave count forecasts!
With a-b-c out the way r u, we should expect another 5 wave up? Or do u think this a-b-c is part of a larger wave A??
cant be sure the abc is finished yet. and not sure this abc could be part of an A wave. It might acutally be a B wave but thats beyond me at the moment.
Similar threads
- Replies
- 0
- Views
- 3K
- Replies
- 0
- Views
- 2K
- Replies
- 1
- Views
- 1K


