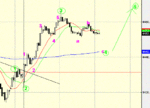
FTSE 100 - May

"you've not been tempted by candles have you" not really. The problem is that candle intraday will in my experience only produce a 50/50 hit ratio. Its really what happens after that. Trendline resistance was hit
and thus we got a rejection.
 
Mully.
Re your post No 814 para 5( Looking at.)
Should your fib 50% be 4415 and not 4472
 
Hooya said:
"Trendline resistance was hit
and thus we got a rejection.
Also 50% ret of range may 5th high may 17 low = 4468
Intra day high thus far = 4466.5 on my print.
kj
 
Fluke,

Sorry about any confusion, but i was trying to say FTSE
has retraced 50% of the move that had topped at 4472, ie

50% of 4472-4363= (0.5* 109 points)=4418
 
Hooya said:
no 10:05 was better entry than 10.30 but know what you are saying
yeah, I like some sort of conformation and then my stops are usually too wide !
I have to get to the point of pulling the trigger earlier....on something like on post #825
kj
 
I only would get in before a trend change if I saw the resistance ahead and everything was looking towards a spike occuring. BUt there was still plenty of time to get 60 afterwards so you dont have to jump the gun
 
Mully.
Sorry about that,I was looking at the retracement when I spotted your chart.I was'nt critisizing you.
lol
 
hooya - agree with you about intraday candles (false trading periods?) but they're much better than 50/50 when reversal signals occur at support/resistance levels and they give good clues about the strength of moves.
 
"much better than 50/50 when reversal signals occur at support/resistance" ..

.exactly hence why its the s and r that is more reliable than the candle???
 
looking like another push up later??
 

Attachments

  • anythoughts.GIF
    anythoughts.GIF
    38.9 KB · Views: 154
I am really stuck in no mans land at the moment. 5 mn says up 10 says down..:)

2 different :( wave counts pointitng in opposite directions
 
if its following my chart above i t should bounce here and not trade below 33 . but its nearing the end of the day...
 
well it nwent below 33 which suggests that we could now be in c wave down as indicated last week...we borke back under a trend line, and few indicators crossed over..etc so we might see that 403 fib tomorrow. Only one trade for me which I should have held longer. Hopefully a few more posts tomorrow?
 
Top