You are using an out of date browser. It may not display this or other websites correctly.
You should upgrade or use an alternative browser.
You should upgrade or use an alternative browser.
leeshindig
Active member
- Messages
- 140
- Likes
- 0
Bonsai,
I was just browsing a dance music site and come across a record label called bonsai records, so I cropped the records off the bottom and hey presto youve got a nifty trendy logo...lol
thought it might give you a chuckle.....
have a good weekend
Lee
I was just browsing a dance music site and come across a record label called bonsai records, so I cropped the records off the bottom and hey presto youve got a nifty trendy logo...lol
thought it might give you a chuckle.....
have a good weekend
Lee
Attachments
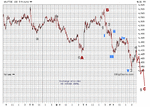
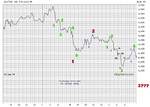
Bonsai, is probably going to say no no no to this but
Im going to keep on trying until I get this EW stuff. This is
what I have come up with..As you said Bonsai at end of
Friday , it looked like 5 wave C might have finished at the 45
fib level, but with the US weak close I am wondering if we could still be in C with leg 5 to come??? What do you think. I admit there
is some bits I cant count but this is the general idea🙂
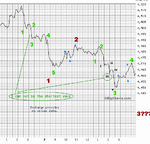
also target would be 1.618 X A.(which would also be a 38% retracement from the NOve 20 spike low)???
Edit: Also we could ignore the grey count in C and just go with the blue which would still leave us in V of C?????( that would make the grey 4, 2of V of C)
Attachments
Last edited:
barjon
Legendary member
- Messages
- 10,752
- Likes
- 1,863
Bonsai
Thanks re GSK and AZN.
Hooya
Given up on EW since it's all too deep for me!! Have dug out Steve
Nisson's Japanese Candlesticks and read up on using candles
with EW. Best bet seems to be to look for a candlestick reversal
indication @ the wave target level. So the target on your
proposition is :?: I'll keep an eye on the candles around that level
on the 1 hour chart if gthat's what you're using.
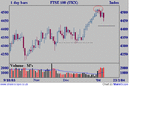
In the meantime I'll be looking at fib 418 with interest (see chart)
if there's more down coming. The warning was sounded by the
small hanging man and the following high wave candle (circled).
Attachments
Last edited:
barjon
Legendary member
- Messages
- 10,752
- Likes
- 1,863
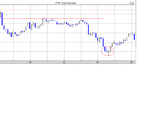
As you know I don't trust candlesticks on "artificial" time periods
(particularly the odd 9 per hour Yahoo version) but I may have to
change my mind if they keep working like Friday. Real wise after
the event stuff since I was out all day 😀
The longest candlestick was the early down and its mid-point
provided resistance (red line). The low was called by the
inverted hammer and the following hammer (circled).
Attachments
Hooya
Elliott:-
sorry if it sounds as though I keep saying no, no, no.
but I think you know I am trying to help.
a couple of thoughts occur to me.
1- I can't read bar charts for love nor money. Never use them for that reason.They often make it very difficult to see what is going on.
2- Can I suggest that you always do wave counts using the same time interval. You can quite easily get different counts if you use different time periods and that may only confuse.
btw, Elliott used hourly charts.
3-In trying to make a count, you should always look closely at every little wiggle on the charts. You can't include some and ignore others. (well, not regularly anyway). There is a chapter in the book that tries to address fractal progress. And remember 4 waves usually last longer than 2 waves.
so I have marked up your chart with queries for you to consider.
no need to answer them. just want you to think about them.
Finally, what I actually said was
I know it's tricky. May be best for you to learn by waiting for a move to be completed and then go back and do a wave count rather than trying to do it on the fly.
hope this all helps.
Elliott:-
sorry if it sounds as though I keep saying no, no, no.
but I think you know I am trying to help.
a couple of thoughts occur to me.
1- I can't read bar charts for love nor money. Never use them for that reason.They often make it very difficult to see what is going on.
2- Can I suggest that you always do wave counts using the same time interval. You can quite easily get different counts if you use different time periods and that may only confuse.
btw, Elliott used hourly charts.
3-In trying to make a count, you should always look closely at every little wiggle on the charts. You can't include some and ignore others. (well, not regularly anyway). There is a chapter in the book that tries to address fractal progress. And remember 4 waves usually last longer than 2 waves.
so I have marked up your chart with queries for you to consider.
no need to answer them. just want you to think about them.
Finally, what I actually said was
now we have hit the fib, the C wave may have done its job.
we will have to wait and see.
I know it's tricky. May be best for you to learn by waiting for a move to be completed and then go back and do a wave count rather than trying to do it on the fly.
hope this all helps.
Attachments
Last edited:
Thanks Bonsai....everything you say is always helpful. Will have
another look , today and see if I can do better.
edit: nope still cant count for some things...think i will
have to stick to looking at ew in hindsight as you suggested
for the time being.
edit:- best I can do
another look , today and see if I can do better.
edit: nope still cant count for some things...think i will
have to stick to looking at ew in hindsight as you suggested
for the time being.
edit:- best I can do
Attachments
Last edited:
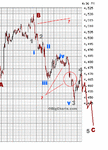
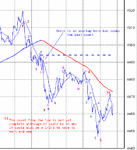
well, you have shown me yours, so fair's fair ?
I have pointed out a weakness in my count but in view of the 'fast' 20 pt drop that ensued, I think its ok. If I could chart
just those 5 legs, it looks like it might have been a wedge.
the 4 wave correction in the final 5th is something you will have to search for in the book. But again it's not uncommon in a 'fast' market. - I think of it in terms of market makers being taken by surprise. (just a working hypothesis)
The pullback from the low is still ambiguous. The market could fall to 4450 in a 4th and 1/2/3 could still be intact. -a bit nasty ?
(Doing a count in this detail is very time consuming. )
Expect to be back later in the week.
Attachments
the reason why I didnt go with that count (although I wouldnt
have probably got it exactly the same ) is that your pink 4 goes in to wave1 territory and pink c is quite short??
edit:- PS. thanks for taking the time to do it Bonsai...it all
helps
have probably got it exactly the same ) is that your pink 4 goes in to wave1 territory and pink c is quite short??
edit:- PS. thanks for taking the time to do it Bonsai...it all
helps
Last edited:
Similar threads
- Replies
- 982
- Views
- 111K


