Grey1
Senior member
- Messages
- 2,190
- Likes
- 210
The subject of measuring the dominant cycle and the settings for indicators is not some thing new,, In fact if you go back to some of my posts in 2000 you can see why I have always been against those who are after a meaningful trading system using a fixed cycle based TA indicators such as RSI or similar.
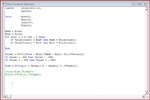
Those of you who are interested in the design of more advanced indicators might find this article interesting ,
Grey1
Those of you who are interested in the design of more advanced indicators might find this article interesting ,
Grey1