Hi RD,
These are my codes and they work for me. You just need to define UpColor, DownColor as inputs. Here, it also shows magenta color when MACCI is either OB or OS.
The codes are embedded in CCI receiver. It can be used in any RadarScreen with any TF as long as you have the matching Symbols. You can send MACCI from 1min, 3min, 5min and you can still receive them from daily RS or 60mins RS, no problem. I will post my RS screen shot when market goes live.
cheers,..
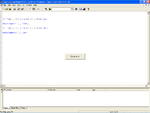
If LastBarOnChart then
CCIAvg1 = GVGetNamedFloat( GetSymbolName + "CCISender1", ErrorCode );
CCIAvg2 = GVGetNamedFloat( GetSymbolName + "CCISender2", ErrorCode );
CCIAvg3 = GVGetNamedFloat( GetSymbolName + "CCISender3", ErrorCode );
CCIAvg4 = GVGetNamedFloat( GetSymbolName + "CCISender4", ErrorCode );
If CCIAvg1 <>ErrorCode then
If CCIAvg1 > 100 or CCIAvg1 < -100 then
Plot2(CCIAvg1, "CCIAvg1", Magenta ) ;
If CCIAvg1 > -100 and CCIAvg1 < 100 then Begin
IF CCIAvg1 > CCIAvg1[2] then Plot2(CCIAvg1,"CCIAvg1",UpColor );
If CCIAvg1 < CCIAvg1[2] then Plot2( CCIAvg1, "CCIAvg1", DownColor ) ;
End;