Forex & Some Other Setups

TrendTracker

Member
Messages
72
Likes
0
AUD/USD at Potential Support

Hello everyone! I haven't been posting here for quite some time now. Been busy working, working and working... I guess that's what most of us live for. Over the last years I have traded and worked with both retail and instutional traders and have leant a thing or two about markets. So, I thought it might be fun to post some potential setups every now and then. If this turns out to be fun and beneficial for both you guys (and girls) then maybe I'll keep on doing this. Let's see how it goes. :)

Weekly_02052014.png

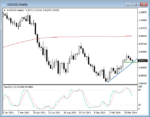
AUD/USD has seen three consecutive weeks of moves lower. The pair has now reached a potential support level with ascending trendline and a weekly low from a month ago. This is worth keeping an eye on in daily and intra-day timeframes. (Hope the chart is visible as the preview had some trouble showing it.)

Edit: it seems that the chart I Jinged (server at screencast.com) isn't working. Can anyone help me with this?

Edit II: Got the chart uploaded ok.
 
Last edited:
Views but no help... is that all I'm getting?

Isn't there anyone who could tell me how to add charts to my posts?

I mean this can't be very difficult question... Surely someone can tell me how to add a chart...

if anyone can't be bothered to help a bit, it's going to be a bit challenging to contribute to this forum... :(
 
click on the go advanced button below the massage box.
click on the paper clip nest to the smiley face.
click on browse and up load picture.
then click on the dropdown button next to the paper clip and attach the photo.

hope you can use this info.
 
Last edited:
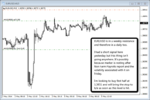
4h spike / hammer indicating the support will hold

Earlier today: AUD/USD has seen three consecutive weeks of moves lower. The pair has now reached a potential support level with ascending trendline and a weekly low from a month ago. This is worth keeping an eye on in daily and intra-day timeframes.

240min_02052014.png

In the above link is a 4h chart of AUD/USD, which shows a 4h hammer with a long spike to the support. This was caused by the Non Farm Payrolls release earlier today. In fact, it'd be more correct to say that it wasn't only used by NFP release but also some institutional buying. Professional money stepped in when the move got too extreme. This is a bullish indication and supports the idea seen in the weekly chart (rising trend line and horisontal support level co-inciding). I'm looking for long setup in 15 min timeframe.

If my long setup/signal occurs and is triggered, I'm looking to sell first ½ of my position at around 9380 and bring stop to break even. The other half I'm looking to sell above 9506.

Thanks to Traderallen I was able to upload the 240 min chart. :)
 
Last edited:
Thank you sir! :)

click on the go advanced button below the massage box.
click on the paper clip nest to the smiley face.
click on browse and up load picture.
then click on the dropdown button next to the paper clip and attach the photo.

hope you can use this info.

Hello Traderallen!

Great to have a friendly face here! Thanks a million for helping me out.

Cheers!

TT
 
Isn't there anyone who could tell me how to add charts to my posts?

I mean this can't be very difficult question... Surely someone can tell me how to add a chart...

if anyone can't be bothered to help a bit, it's going to be a bit challenging to contribute to this forum... :(

classic dude .....classic :cool:
 
USD/CAD Weekly and Daily

Hello everyone. Here's another one, USD/CAD this time. I'm intending to write my analysis so that the new comers will understand what I'm talking about. Please let me know if something needs clarification.

weekly_05052014.png
Weekly USD/CAD
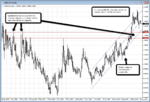
The pair moved outside the rising 2 stdv channel in the end of 2013, which usually isn't a move that can be sustained. Now price has moved back inside and consolidated. From the above weekly chart we can see that there is a significant support level below. It is kind of wide area but hey, it's weekly chart. If price gets there it's very likely to encounter some serious buying. I'm not saying it will happen, but in my experience weekly levels are important. Therefore it's likely that buyers will keep their eyes open should price get there.

daily_05052014.png
Daily USD/CAD
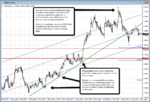
Rising trendline gave support when price moved from being oversold in relation to the 2 stdv channel. But later on the same trendline acted as a resistance and turned the price lower. This suggests the best buying levels should be somewhere in the direction of south from current levels.Therefore the potential support at 1.0780 which is confirmed by the Fib extension level is certainly worth a second look if price gets there. I have placed an alert inside the levels so I'll be awake when / if price should move that low.

Reasons to look for buy setups at or below 1.0790:

1) pair oversold in relation to 2 stdv channel
2) price at previous resistance that is now likely to act as support
3) fibonacci extension levels co-incide with these levels

If this level is reached, we will look into smaller timeframes and see if we get a nice buy setup. Hope you found this useful. I hope you all the best in your trading! (y)

Cheers!

TT
 
USD/CAD intra-day today

1h_05052014.png
1h USD/CAD
Here's something to look at in the intra-day chart today and tomorrow. The potential resistance is a former support (red line) at 1.1015 could work as a target for a quick intraday trade. The blue and green support lines are based on the price action from previous days and could work as long entry levels with a tight stop.

Should you want to define your stop better (make it tighter) go into smaller timeframes once the price in 1h chart is at support or below the blue line. In a five minute timeframe you should be able to use your favorite indicators or buy setups to identify the change in the momentum.

Hope this helps. All the best!

TT

BTW, if you like the analysis I do, please let me know and give me a thumbs up. :)
 
Last edited:
USD/CHF at support

Daily_05052014.png
Daily USD/CHF

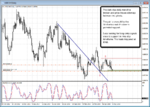
The dark blue daily trendline is broken and price moves sideways between two pivots. The pair is oversold in terms of Stochastics and it's close to potential support, so I was looking for long entry signals close to support in the intra-day timeframe. This trade triggered at 0.8768. Sell stop at 8760 and target at 8812.

Some of the setups I post here are based on new ideas that I test. And I test them with demo account (I suggest others do the same in case they want to them out). I would not recommend anyone to test anything new with real money. See how it goes first, then move to micro account and only after you earn the right to trade your new strategy, ie you make money with it. Only then you should increase your trading size. And: never risk more than 1% of your account!

Cheers!

TT
 
Last edited:
Headwinds... stop to b/e

30min_05052014.png
30 min USD/CHF
There are some intra-day headwinds (see the 30 min chart) so I'm bringing my stop to breakeven (for newbies: the level where the buy happened). I'm also looking to sell half my position at potential intra-day resistance (again see chart).

Now this trade is risk free. Should I get stopped out it's only going to cost me the commission. In my experience getting to a point where your trade is risk free is very important. New traders too often emphasize the profits side of equation... and will lose - often way too much to stay in the game for the long run.

The most important rule is: Do NOT lose money. If a new trader takes care of the risk control the market will take care of the profits (providing the system for entries and exits is valid).

I'm hoping these quick posts will help the newcomers to get some useful ideas that will over time help to create your own profitable routine / strategy. Please, let me know if you find these useful.

Cheers!

TT
 
EUR/USD short

15min_05052014.png
15 min EUR/USD
In the spirit of full openness I'm posting this one too. Not a great trade and I'm even at the time of writing this wondering whether I should scrap this one. However, as this is a test I will be disciplined and see what happens. I've done my analysis and I've set the orders so I should just stick to it and see it through.

Maybe you'll learn from my mistakes too... Anyway, I think that cherry picking is not going to serve anyone. Not you and certainly not me. I need to be honest to myself before anyone else but I need to be honest to all the readers too.

EUR/USD is in a weekly resistance and therefore in a daily too. I had a short signal here yesterday but this thing isn't going anywhere. It's possibly because market is resting after Non Farm Payrolls report and the volatility assosiated with it on Friday.

I'm looking to buy first half at 1.3851 and will bring the stop to b/e as soon as this level is hit.

TT
 
Usd/cad

In a hurry today so I am just posting quickly without charts. Referring to my earlier USD/CAD post I've placed the following orders: Buy limit at 1.0946, Stop: 1.0940, Target 1: 1.0960, Target 2: 1.0987.

R/R = 4,6


TT

PS. If you want to try these setups, please use a demo account. If (after several months) you find that my setups are reliable, only then consider trying them out with real money. And then I would suggest using micro account first.
 
Last edited:
EUR/USD stopped

"In the spirit of full openness I'm posting this one too. Not a great trade and I'm even at the time of writing this wondering whether I should scrap this one."

Stopped with a loss of 1% of acc. size. Sometimes it'd pay to listen to the intuition... If only I knew when... :)

TT
 
EUR/USD looks like a buy

Been busy lately... therefore haven't been able to look at the markets or post here. However, EUR/USD looks like buy at the mo. Here's what I looking at right now:

Long entry at: 1.3717
Stop: 1.3697
Target I: 1.3771
Target II: 1.3880

R/R: 5,4

Cheers!

TT

Edit: Long Entry limit triggered at 1.3717
 
Last edited:
EUR/USD analysis

"Long entry at: 1.3717
Stop: 1.3697
Target I: 1.3771
Target II: 1.3880"

daily_13052014.png

Let's look a the the rationale behind this trade. EUR/USD has fallen to levels where it is close to a support level, best visible on the Line On Close chart. The pair has reached the Bollinger Bands and is getting close to a 200 period moving average, which at the moment is still rising. In addition, both the Stochastics and CCI are oversold. Therefore the currency pair should be close to levels where this recent downmove is getting too far from the recent 50 period average price.

Cheers!

TT
 
Top