Hi everyone,
The latest Commitments of Traders review is out.
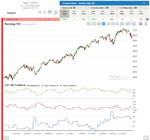
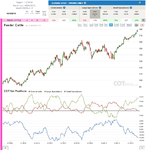
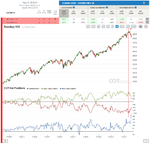
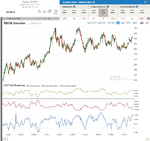
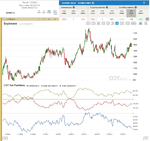
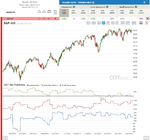
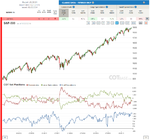
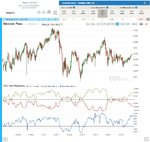
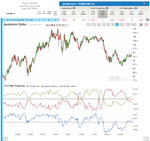
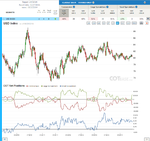
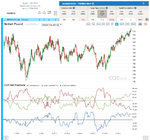
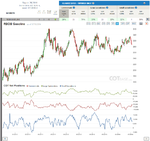
Nasdaq-100
COT Change (52W) / C – 44%, LS –39%, SS - 12% /
COT change signals – in my experience – were successful signals many times in indexes. The large change in Traders positions in this recent cot report could be again another good signal (bullish of course). The cot extreme of course is pointing in the other direction, so any bullish trades should be taken carefully.
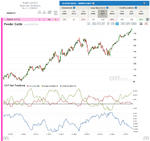
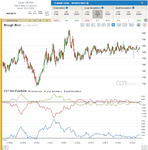
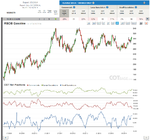
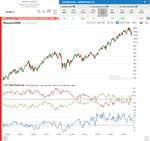
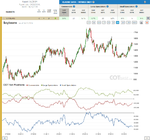
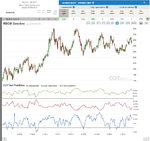
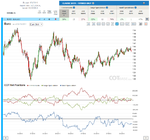
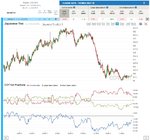
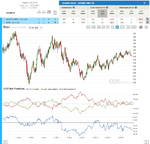
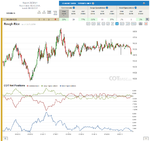
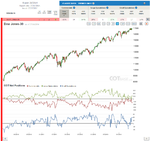
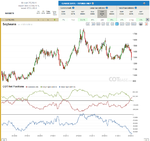
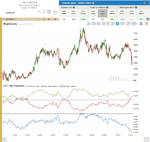
Feeder Cattle
COT Extreme / C – 20, LS – 103, SS - 105 report COT extreme /
The cot extreme is becoming significant, we should start expecting a top soon… on the other hand, this extreme can grow further, volume and open interest scores are supporting the rise.
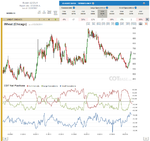
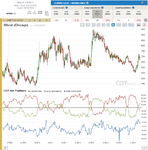
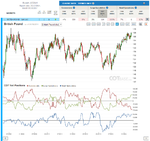
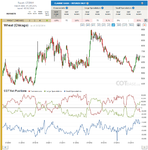
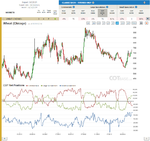
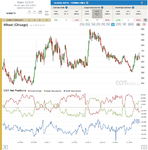
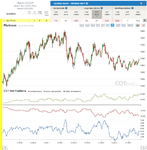
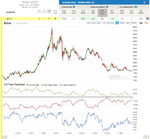
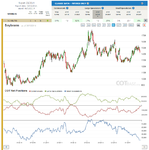
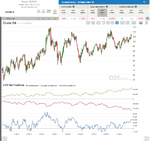
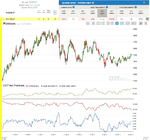
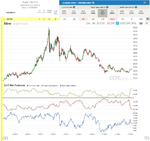
Wheat
COT Extreme / C - 67, LS – 67 report COT extreme /
Similarly to FC, the extreme is large, but there is no reason to think that prices can’t go further UP --> In the last 5 years, we have had two larger extremes that were capable of ending rallies. I would say that the bullish cot extreme from the end of last year (that started the recent rally) is still in place.
All the best,
Dunstan
the original COT report
COT charts
The latest Commitments of Traders review is out.
Nasdaq-100
COT Change (52W) / C – 44%, LS –39%, SS - 12% /
COT change signals – in my experience – were successful signals many times in indexes. The large change in Traders positions in this recent cot report could be again another good signal (bullish of course). The cot extreme of course is pointing in the other direction, so any bullish trades should be taken carefully.
Feeder Cattle
COT Extreme / C – 20, LS – 103, SS - 105 report COT extreme /
The cot extreme is becoming significant, we should start expecting a top soon… on the other hand, this extreme can grow further, volume and open interest scores are supporting the rise.
Wheat
COT Extreme / C - 67, LS – 67 report COT extreme /
Similarly to FC, the extreme is large, but there is no reason to think that prices can’t go further UP --> In the last 5 years, we have had two larger extremes that were capable of ending rallies. I would say that the bullish cot extreme from the end of last year (that started the recent rally) is still in place.
All the best,
Dunstan
the original COT report
COT charts