firewalker99
Legendary member
- Messages
- 6,655
- Likes
- 613
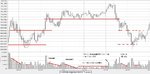
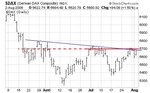
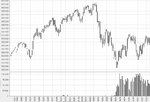
FX_Cowboy said:I really don't have any deep insight to offer here. At the time the chart was made, price had failed to break out through resistance that had held for quite some time, and had retraced to a support area. In other words, for the last day or so, price had been falling (look at the first bar from 7/31 and compare to the last bar printed on the chart).
Given that scenario, I would not be considering a long for the sole reason that I see no indication that price will head back up again. Sure, price was at a level that had provided support in the past -- and also had been broken in the past. But price breaks through support and resistance levels all the time. All I was saying was that there was no indication (that I could find) for a long, so I would not have initiated a long at that point. I should add that I certainly did not know at that point that price would continue to fall either (perhaps a more experienced trader could have seen that coming). So, with no reason to initiate either a long or short position, I would have waited for some reason to enter a trade.
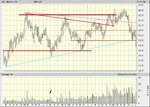
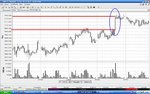
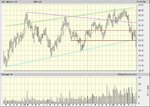
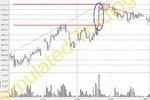
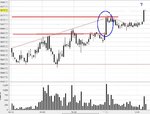
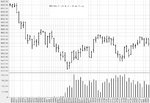
Thanks for answering that question, so I can state that "absence of evidence" was evidence to NOT enter a trade. I understand what you're saying. Could you let me know your comments on my charts of today? It just looks quite similar situation there...