Best Thread Firewalker's Journey: A path of discovery in search for enlightenment

Status
Not open for further replies.
Joey said:
Looks like you are making much better progress with your own efforts.
Best to stay on one time frame although the main trend is more clearer on the 60min or 120min charts.
Are you trading both Nasdaq and Dax.
Where do you get the charts from.

Thanks Joey.
The charts are all drawn myself. Just images or screenshots from my broker (IB) with lines or annotations on it myself.

I used to be trading DAX alone, but this didn't work out so fine. Now that I put the NQ next aside the DAX for the evening session I can relate much better in the moves and things came much clearer. Also, I've found the NQ to be much more comfortable for placing stops which impeded my learning process. Like Douglas wrote "... the amount of money you risk per trade should be an amount that you are completely comfortable with. If you don't stay within this tolerance level, you will be, at the very least, uncomfortable, in which case to whatever degree you are, you shut down the learning process."

Where do you find yourself in your trading?
 
En route...

Stepping along, another thing that made me go forward instead of staying in the circle was to summarize at the end of each day, a number of things that could need improved. These could be items related to the setup, to the trading, to the emotionless state, to my own thinking or feeling. I just write it down on paper and look at it the next morning before the day opens. Some things off course need fixing over the long term, for others an immediate reminder can help me focus. One example: I used to feel too much anxiety when the DAX opens, it was a combination of feelings that made me somewhat too "eager" to jump into a trade.

Now I read and speak the following sentence aloud each morning "don't be in a hurry to catch a loss". Today for instance, quite some time passed and no setup appeared. Then eventually one did appear but I was away from keyboard. When I returned I could have entered but this would have been a compromised trade. I decided to leave it and don't chase my trade. So, in a way, these are all definitely "changes" in myself, I'm finding myself en route to a more relaxed and neutral way of looking at the market. Although still a long way to go, I think this behaviour in particular can help me a great deal in developing a sense of discipline.
 
NQ September 20

news: 2015 (1315 on chart) was intrest rate statement
 

Attachments

  • nq0920sr.jpg
    nq0920sr.jpg
    60 KB · Views: 251
NQ Trades of today (sep 21)

Red dots indicate short entry, green dots long entry
Blue dots indicate the exits of the trade. I'm trading two contracts.

4 trades today:

1) shorted below R, got stopped out however: -8pt
2) long, however an emotional trade, this was not part of the plan, the trend was downwards, I should have waited longer but I thought the S would have hold. But off course we need to remind ourselves to stop thinking at the moment because these "thoughts" are more feelings of what we would like to happen, instead we only need to "act and react" on the signals from our setups. So another losing trade: -8pt
3) Long, first one exited near the R, +5pt, next one out at BE
4) Shorted below previous R, target (next S/R zone) wasn't yet in sight, but the 4 successive bars denying price to go lower gave me a warning sign, so I exited one, and placed the next at BE. I exited the second contract before my stop was hit because I saw price stalling and going nowhere ànd EOD was near: +4pt in total

Summary = -7pt

In hindsight, I should not have traded countertrend the first long.
Otherwise I'm always feeling uncomfortable when price is making new highs like on days like this. I don't want to pick the top, but then again an important part in analyzing the price action is being able to distinguish a retracement from a reversal.
 

Attachments

  • nq0921sr.JPG
    nq0921sr.JPG
    63.3 KB · Views: 286
Hi FW,

Are you using volume analysis as part of your setups anymore or just price action?

My reason for asking is that after the fomc announcement there was over 10000 contracts traded at a closing price of around 1661.25, then today at around the same price only around 5000 contracts at 9am.(less sellers). Now , price starts moving up with huge volume on the wide range body at 9:48 . Question, does that confirm reversal to you or is it fractured volume(my new favorite thing to look for)? Socrates explained it on a DAX chart of yours a month or so ago.

Now on each subsequent bottom, volume is increasing with another fractured volume bar at 15:00. Will price retest or make a new low and if it reverses will the 9:48 bar be a good profit target? Who knows, but for me understanding price action only without volume just seems harder. That being said, volume has also confused the hell out of me, but that's part of the fun for me, understanding the puzzle, understanding the intent.
 
rainman2 said:
Hi FW,

Are you using volume analysis as part of your setups anymore or just price action?

My reason for asking is that after the fomc announcement there was over 10000 contracts traded at a closing price of around 1661.25, then today at around the same price only around 5000 contracts at 9am.(less sellers). Now , price starts moving up with huge volume on the wide range body at 9:48 . Question, does that confirm reversal to you or is it fractured volume(my new favorite thing to look for)? Socrates explained it on a DAX chart of yours a month or so ago.

Now on each subsequent bottom, volume is increasing with another fractured volume bar at 15:00. Will price retest or make a new low and if it reverses will the 9:48 bar be a good profit target? Who knows, but for me understanding price action only without volume just seems harder. That being said, volume has also confused the hell out of me, but that's part of the fun for me, understanding the puzzle, understanding the intent.

Hi rainman,

For me volume has been more of a trouble than anything. Therefore I'd like to keep it out of the equation, unless in specific circumstances it can help me support a hypothesis. For instance, when price is ranging in a not so narrow range after an upmove on medium, but flat volume, than I would consider this to be an accumulation area signaling a continuation of the upmove. No guarantees offcourse. One other example is (more related to the DAX) looking for a selling climax. There are some examples where you can cleare see the downtrend accelerating, finishing on a high volume wide spread body followed by a hammer perhaps or a bullish engulfing bar which could indicate a reversal. Neither of those would form the basis of a setup for me, but could add strength to the hypothesis.

You mention a high volume upbar at 9:48. I wouldn't consider this to be a reversal sign, instead I think it's a sign of strenght after the previous couple of bars where price stalled on flat volume. It's like an egg that burst out of it's shell. However, if a constant upmove on medium or low volume preceded, and suddenly this were to happen, than I would consider it a possible sign of euphoria of the herd. They would be bying near the top, however top picking in itself is a risky business. The next couple of bars after this WRB are all relatively small.

Are you using horizontal volume of some kind? I'm asking because you mention the volume at a specific price level... Personally, I don't refer to other days or time frames to compare volume at certain price levels. Especially when there's news than I'd rather just leave that bar out of the equation and focus on the rest of the chart. I must admit I'm feeling uncomfortable trading around news and especially on the DAX you have to careful for it not to cleansweep your account. Take a look at the attached chart for instance, the news spike at 14:30 is 30 points big... Consider leaving this and the following three bars out of the chart and suddenly it seems as if there was no news and price just went on it's way.

About the (near)EOD bar at 1500: this is in fact the closure time of most markets so it's quite useful to have higher volume at this point. Have a look at a couple of NQ charts at you'll see that volume has always been around 5000-7500-10000. In fact, I've found the EOD bar to be the highest volume bar of the day, except when there was news...

I appreciate your comments and any other insights you may have to offer to don't hesistate to ask :) Which instrument are you trading by the way?
 

Attachments

  • 20060915.jpg
    20060915.jpg
    58.3 KB · Views: 237
Hi FW,

I also used to think that a high volume up bar was an early sign of reversal(strength) but have since come to understand it to be that there are still more sellers left. In other words, for price to reverse, price should increase on low volume(no more sellers) with volume coming in after a higher low(momentum) and even when a high volume candle comes(signafying potential end of move before retracement) what was the volume in relation to the previous volumes. under 5000 contacts on the 3min(odds in favor of reversal?), over 10000 contracts(suckers rally?)

I don't use horizontal volume but am always cognizant of price action at high volume areas. I read a little bit about market delta and vwap but am not sure that they tell me more than I already know just by looking at p/v. I do use high volume price areas as profit taking opportunities.

I can understand why you don't like to trade the fomc but leaving out what p/v does during that time imho is a mistake. I'm actually going to use the high and low of the day as an s/r zone. If "smart money" puts so much time and effort into analyzing every single word of the statement , what price does on that day has to mean something.(I think???)

I trade IWM which is the etf for er2. It tracks $ndx pretty consistently. I have a support zone of 72.00 to 72.20 and resistance zone of 72.73 to 72.85. I would post a chart but don't know how to post so that my attachment will show up as a thumbnail.
 
Where we are now...

We've passed the 500th post... I'm amazed at how fast this journal has grown, especially in the early days, yet only two months ago but it seems a lot has happened since then.

This could be a good time to reflect on what's happened and look forward to what's coming, but I think I'll let the journal speak for itself. Personally, I think I'm stepping out of the circle I've been running around and nearing a point where what once seemed very elusive has now come within reach. As always, and as I said from the beginning, I won't give up no matter what or no matter who. My motivation remains big, not only to prove those wrong who claimed I perhaps didn't have what it takes or didn't want to do the work, but also and primarily to become a fulltime trader.

Enough of this now, back to the work...
 
Hi FW,

From the "Even a blind squirrel finds a nut every now and then category", an example of fractured volume happened today on iwm.

Narrow range bars staying above support 71.20

2 up green bars on increasing volume with price breaking out of s/r zone. 71.45

Price retraces back to 71.45, look at all that volume ( the most since the decline begins BUY,BUY,BUY)

making money, doji, doji, uh oh, uh oh, stopped out.

FW, I like you am trying to put a consistently profitable trading plan together and if it wasn't for volume analysis I would have gone long at 71.45 and get stopped out. Just like there are price patterns, there are also volume patterns and I wouldn't just discount them from your trading plan. Hope you had a profitable day trading.
 

Attachments

  • 2006-09-22_181323-iwm5minfv.png
    2006-09-22_181323-iwm5minfv.png
    34.2 KB · Views: 271
rainman2 said:
I can understand why you don't like to trade the fomc but leaving out what p/v does during that time imho is a mistake. I'm actually going to use the high and low of the day as an s/r zone. If "smart money" puts so much time and effort into analyzing every single word of the statement , what price does on that day has to mean something.(I think???)

It depends on what you think smart money is up to.... Like some people think that smart money acts in the last hour of the day (interesting read at http://www.tradingmarkets.com/.site.../wmgame/Tracking-the-last-hour-of-trading.cfm)...

It's not that I just close my eyes for news, I just don't like to trade it... to much going around up and down, getting whipped out like that has caused me enough of troubles. I just think news is a way for smart money to unload or buy into the massive volume. There are enough examples where you can see it overshoot, only for price to return back to the level previous to the news release and continue whatever trend or sideways move it was doing then...
 
rainman2 said:
FW, I like you am trying to put a consistently profitable trading plan together and if it wasn't for volume analysis I would have gone long at 71.45 and get stopped out. Just like there are price patterns, there are also volume patterns and I wouldn't just discount them from your trading plan. Hope you had a profitable day trading.

I had a look at IWM, but I'm looking at very large upspike and a very high volume bar after the US markets have closed... anyway I check ER2 and I must say I think you were right that signals were indicating a long, but not at that point, instead near the end of the accumulation period. The rectangle lasted for about 2 hours. I don't follow ER2 so I don't now where S/R are, and I just drew them on this particular chart reading from left to right.

I can see volume giving some hints, but taking the long where you say is near a level where price previously found resistance and subsequently had a shooting star with a very large wick in comparison to the body. I don't pay that much attention to single bars, but this one should be a warning sign to me, especially at the high volume it generated. Basically, I think price isn't ready to break out of that range yet...
 

Attachments

  • iwm.jpg
    iwm.jpg
    57.1 KB · Views: 235
  • 2006-09-22_181323-iwm5minfvfw.png
    2006-09-22_181323-iwm5minfvfw.png
    43.7 KB · Views: 257
  • er2.jpg
    er2.jpg
    62.2 KB · Views: 232
pullback

Rainman, I don't usually talk that much about volume but while we're at it... :)

this morning I thought that what I was looking it was a pullback
and indeed, it turned out to be one, however the trend discontinued and only a small profit would have been the case if you were to take this kind of trades...
 

Attachments

  • pullback.jpg
    pullback.jpg
    69.1 KB · Views: 270
DAX 21-22 September

2 day view
Look how the PDL and PDC form resistance.
 

Attachments

  • dax21-22.jpg
    dax21-22.jpg
    53 KB · Views: 258
News

Rainman,

Here are two fine examples where you can just leave news out of the equation.
Price just seems to continue where it left out, before the news.
 

Attachments

  • daxnews2609.jpg
    daxnews2609.jpg
    62.8 KB · Views: 214
  • daxnews2609a.JPG
    daxnews2609a.JPG
    59.2 KB · Views: 222
  • 20060901.jpg
    20060901.jpg
    54.2 KB · Views: 230
  • 20060901a.JPG
    20060901a.JPG
    48.5 KB · Views: 218
firewalker99 said:
Rainman,

Here are two fine examples where you can just leave news out of the equation.
Price just seems to continue where it left out, before the news.
Hi FW,

I agree, fomc days are risky to say the least, but if you feel that price will go back to its trend, then a reversion to mean trade could be possible.

Here's an s/r chart of iwm using only the high and low of fomc days going back to 11/1/05. Interesting short opportunity for me when with good risk/reward if price breaks below 72.20
 

Attachments

  • 2006-09-28_090548-iwmdailyfomcdaysr.png
    2006-09-28_090548-iwmdailyfomcdaysr.png
    28.1 KB · Views: 233
Nice long entry

The line at 1671.25 isn't valid anymore.

But the downtrend ended in a steep decline finishing with what is in hindsight the selling climax.
The green dot marks an entry point which confirms the trend is broken: price is above LSL, has broken both TL's and didn't make a new low. I took some decent points out of this one as it went further all the way to 1678.75
 

Attachments

  • nqSperandeo.JPG
    nqSperandeo.JPG
    61.6 KB · Views: 236
Backtesting

The process of backtesting has been a long and difficult one. For the purpose of reflecting to this at a later time, I decided to write it down a bit. My setups aren't perfect, nor do I believe they are going to work forever without tweaking or adjusting. Looking at the DAX, I have to take in account that the average daily range is a lot smaller than 6 months or longer ago. If markets can change over months, they can certainly change more over years.

The data I checked were about 200 intraday charts. I was looking for a setup that allowed me to take 3-5 trades a day. I realize this objective was not based on experience but on a personal subjective need willing to make an arbitrary number of trades each day. Some people argue that you should focus only on one market at a time, but I've found it illuminating to compare different markets. I've actually learned a lot from looking to the NQ where imo price moves where much cleaner and volume had more significance than on the DAX. A lot of people will probably argue with me on this, so let's just stick to the fact that I've been able to "read" the signs better at NQ. Anyway, I happened to find some setups that all together give me 3 to 5 opportunities each day,...

I won't ignore nor deny the fact that I've learned a lot from others and for developing a plan the steps described in the Trading Journals thread (posts #5 and #8) were quite helpful. One of the most important "insights" I've acquired is I've let go of the idea wanting or needing to know why price is doing this or that. I just needed to find a way to profit of it.

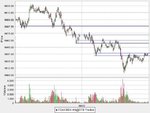
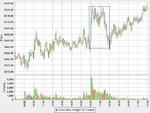
For backtesting I took batches of about 100 trades. I wrote almost everything I could see about the situation in the chart: what happened before, what happens after, what kind of volatility, around what price level, the volume it showed, etc... leaving indicators totally out of the equation. I looked at the results and compared them to another batch, and another one, and yet another one. After a while you get to see things, you find that price isn't moving totally random and there are ways to profit from. Ofcourse, all this isn't found in backtesting, but backtesting is proving (or disproving) certain hypotheses I had. The next step was in looking where you could find the best entry, find a suitable stop size and a possible target...

After forward testing it for a while, I found it actually did hold a lot of possibilities. I just needed to clear my mind of all the distractions and letting go of the need to understand why some trades were losers. Some trades are just bound to be, it's part of the probability a system generates.

I'm at the point where I'm still looking for small refinements but am confident the system shows a positive expectancy and hence will automatically lead to an increased equity over time.

Currently, I am implementing the setups in real time using one contract but trading only one contract is difficult. You don't have the luxury of taking a less-then-perfect entry and you can't let your profits run to its maximum (no scaling entries nor exits). Still, the results show potential and basically I know that if it works with one contract, the system will be more flexible using two.

The DAX has been moving around about to 100 points at some days, but the last couple of weeks the daily range has been quite small (30-50 points) but with a 25EUR per point, I started to focus on NQ which is only 20$ per point but shows less relative volatility. The road is long and winding, but I believe in the outcome and am confident I've chosen the right direction.
 
Last edited:
rainman2 said:
Hi FW,

I agree, fomc days are risky to say the least, but if you feel that price will go back to its trend, then a reversion to mean trade could be possible.

Here's an s/r chart of iwm using only the high and low of fomc days going back to 11/1/05. Interesting short opportunity for me when with good risk/reward if price breaks below 72.20

I think the high and low of those FOMC would coincide with S/R levels that also show up on other times... I could be wrong?
 
Patience pays off

Only one trade today (NQ), and it turned out very well.
In terms of patience this has been a great improvement. Next week is a new month, with a new target: discipline. I will take a look at wasp's journal again, who had been struggling with discipline but succeeded in overcoming his gremlins.

I think I'm crawling out of this Catch-22: to trade with confidence and without emotion, you need to believe in your system. But to believe in your system, you need to have confidence to act on it (even if it gives you losing trades, which it inevitably will do from time to time).
 
Personal Reminder

Never change the settings of a trade after you are in a trade, because at that point emotions kick in and you cannot act objectively anymore.
 
Status
Not open for further replies.
Top