Fibonacci-Trader Discussion Board

Waverider,

The purpose of this particular board is to use Fibs as a basis of discussion.
And to build on that to see how each of us tweak or add to that basis to make use of Fibs.

Since many of us appear to have either attended Sandys course, or will soon ( have a nice time andrewmooton ), it is natural that forms our common knowledge, and terms of reference.

But, I want us to move beyond that, and see if we cant build a better strategy around Fibs.

re: the 2-bar reversal: I thought he used pivots, with a trigger being a single bar that both breached the Fib-level and also closed above the fib-level to buy, OR breached the Fib-level and closed below for a sell trigger.
( This is actually the reason why I believe his methods are swing-trading with a fib-spin ).
 
There is another thread that strikes me as perfectly adequate for discussing Fibonacci- the need to start again eludes me other than some may think the thread isnt heading in their preferred direction.

I am still interested in what gnometric (or whatever the expression was) expansion means, but beyond this, this seems more like an SJ stroking course!

Fibonacci was a great mathematician, some would say the founder of number theory. But I agree with earlier posts that a confluence of events is more meaningful, not Fib alone (and that still doesnt tell you how to trade it!).

Further, until SJ students become the biggest influence on the markets, it is unlikely that seeking the commonality will lead to much except a blind alley. IMHO Better seek the alternative views.
 
Fibonacci Numbers:

I wont go into the history of who he was etc, as this info can be gleaned elsewhere. Nor will I go into the ubiquity of the Golden Mean.

The numbers are derived by taking the numbers 0 and 1, and then adding the latest two numbers to derive the next number.

For example, 0 + 1 = 1. ( the sequence is now 0, 1, 1 )

Now add the last two numbers, 1 + 1 = 2. ( the sequence is now 0, 1, 1, 2 )
Now add the last two numbers again, 1 + 2 = 3. ( the seq is now 0,1,1,2,3 )
One more time !! ( 2 + 3 = 5 ) this gives, 0,1,1,2,3,5.

This can go on indefinitely. Since T2W doesn’t possess that amount of web-storage, the next few numbers are:
0, 1, 1, 2, 3, 5, 8, 13, 21, 34, 55, 89 etc

Now, if you divide each consecutive number, the further along the sequence you are, the result tends to the famous Golden Mean, which is about 1.618, and its complement, 0.618.

For example, 2 / 3 = 0.667. 3 / 2 = 1.5.
For example, 3 / 5 = 0.6. 5 / 3 = 1.667.
For example, 21 / 34 = 0.6176. 34 / 21 = 1.619.

As you can see, the further up the sequence, the closer the results are to these 2 numbers.

The square root of 1.618 is 1.272.
The square root of 0.618 is 0.786.

So as I don’t get carried away, I am not going to use the 38% figure.
( it is derived by squaring 0.618. ( 0.618 * 0.618 = 0.3819 )

The main reason for this, is to start with the basics, and build on these basics.

If contributors feel strongly about some retracements, and can make a good case, then we should adopt them. Otherwise, it is best to prove the basics, before adding more lines.

I am concerned that if we throw enough lines onto a chart, we can prove anything !!

So, to start with, I suggest the following 4 percentages are of note:
62% ( rounded from 0.618 )
79% ( rounded from 0.786 )
127% ( rounded from 1.272 )
162% ( rounded from 1.618 )

I will take advice from the readers as to whether 50% retracement is valid.
( actually, it probably is, but can the 50% retracement be derived in the context of Fibonacci ? )

This is my understanding of Fibonacci numbers.

I propose the above as a starting place for further analysis.

In the context of trading, markets appear to change direction, or make retracements on these particular percentages. Perhaps more often than other percentages.

If the above is a satisfactory basis, I propose to see how all this can be applied to the markets.
( hopefully there will be contributors with experience of stocks, as my trading vehicles tend to be indices, DOW, SP500, DAX etc )
 
Notwithstanding any proprietary Fib techniques that some may have learnt on courses, I'm interested to establish if anyone has a definition for exactly how Fibs should be applied.

Is there a 'normal' or 'standard' way to apply them?

I've seen them used in no end of ways. Most recent major low to high (whatever 'recent' and 'major' may mean) and also on the time axis i.e. not just Fib price levels, but also Fib tme levels.

Be keen to find others' experiences with Fibs.
 
I know what you mean Bramble.
The numbers look fantastic in hindsight.

Consider this: for the Dow
Last majorLow: 9586 21-Nov-03 0 days ago
Next High: 10754 19-Feb-04 90 days after low
Low: 10007 24-Mar-04 34 days after high
High: 10571 06-Apr-04 13 days after low
Low: 9852 12-May-04 36 days after high
High: 10488 25-Jun-04 44 days after low

90 ( almost 89 ), 34 and 13 are Fib-numbers.
I cant explain the 44. :)

Of course the definition of highs and lows can be subjective.
 
Last edited:
Hi Trendie,

I don't really want to go too deeply into what is taught on the course because I don't think that's fair to the person who's put the course together but my manual shows two bars, which reversed, so that's how I decided to describe it. There is also a version showing two bars but with only one crossing the fib level. If these are called 'pivots', that's ok by me.

"...a trigger being a single bar that both breached the Fib-level and also closed above the fib-level to buy, OR breached the Fib-level and closed below for a sell trigger"

There is only a trade triggered following the reversal, in the direction of the reversal - there's no trade triggered in the original direction if it closes below the fib level.

Hope that helps.

WV
 
A further point for discussion is this.
Where do you decide to base your fib start and end points? Do you go high of the bar to low of the bar or close to close? Is this being too fussy?
When taking a prior peak, and there may be a few to chose form, which do you chose and why? The bottom is easy because it is usually the most recent single event that staisfies the criteria of a low.
 
Good points Chartman.

I understand that its high and low of the bars - not closes.

Determining previous peaks and troughs can be difficult - I get round it by using the "wave" function on my charts !!
I set a range of 3% and off it goes !!
I use Updata EOD. I set 3%, and the program determines a retracement of a minimum value of 3% for it to be recognised as a retracement. Hope that makes sense !!
( I think the wave function is similar to point and figure, in that the market must move more than a certain amount for a change to be registered. )

NB: I use 3%, as the ranges shown suit my personal tastes and timeframes - it is not anything to do with Fibs.
 
Hi Chartman,

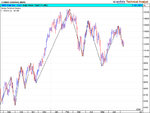
hope the image attached helps illustrate the wave function - it makes it easier , for me at least to see retracements.

I then use the peaks and troughs defined by the waves as my fib-points.


( first image I have loaded, so fingers crossed )
 

Attachments

  • DJIA-01.jpg
    DJIA-01.jpg
    284.8 KB · Views: 819
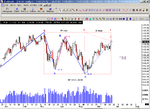
Fib time.....I posted this little while ago.
 

Attachments

  • EW39.png
    EW39.png
    47.7 KB · Views: 1,155
CJ - Do E-Waves generally exhibit Fib characteristics on the time plane more often than not?
 
Yes....Plus there are some rules on time vibrations on both bull / bear wave phases.

Time and price squaring is one of the most powerful techniques to use, but I don't think it would fit into the general context if this thread.

CJ
 
a320
Can you please take an active interest in this thread,I know you are very good at this and would like to continue to learn from you.I have read your work on TT and think it's some of the best I have come a cross.
Could you give us some detailed instructions on your methods in simple lay mans terms.
I am interested in your XABCD moves and I am convinced they work .
Kind regards
 
a320,

Is time and price squaring a Gann thing ?
I recall reading somewhere about the "square of 9" - is it something like that ?

do tell !
 
Gnomonic expansion anyone? Still waiting. Feels increasingly like the land of smoke and mirrors here, and sellers of snake oil.
 
Including Fibonacci Jimbo...?

It's a long, long way (and time) from Rabbit populations to here, but it has acquired a rather more general acceptability than Gann, Elliott and the even more esoteric disciplines.

There's no reason for that (nor not) as far as I can see.
 
Thank you for the kind words..... :eek:
I'm on vacation at the moment, so now's not the best time for me to go off on one on this thread, give a couple of weeks , see how this thread develops & we'll take it from there..

Oh btw trendie, I would urge you to include the 38.2% ;)

a320 said:
As for retracements :cheesy:

Try to identify which Rhythm the market if tracing out... this will give a clear indication of future area's of support or resistance.

Eg Golden mean ( phi/fib) if the market makes a 61.8% correction it is likely to continue to the 161.8% on the impulse after the 1:1 length of the prior impulse is exceeded.

Golden mean ( phi/fib) series
Contracting.... 0.23.6 0.30 0.48 0.618 0.786
Expanding.....1.272 1.618 2.058 2.618 3.33

There are other Rhythms..The Square, The Cube and The Rectangle to name a few... something to Google :cheesy: or refer to Lawlors great work.....
http://www.amazon.co.uk/exec/obidos...23308/sr=1-1/ref=sr_1_3_1/202-1795133-8592647


CJ
 
As a newbie and having an interest in using fibs, can someone suggest which graph type to use for eod tra :confused: ding in fib analysis. Should it be closing price or candles?
 
Top