You are using an out of date browser. It may not display this or other websites correctly.
You should upgrade or use an alternative browser.
You should upgrade or use an alternative browser.
- Messages
- 549
- Likes
- 2
Thanks, a nice post Martin.
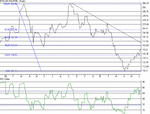
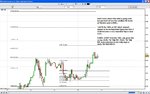
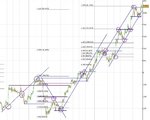
Anyone who doubts the power of Fibonacci have a look at the attached chart of Kier group KIE. A grid drawn between the high of 18.01.2000 and the low of 25.05.2000 projects each pause up to the recent high, and also the retracement in Sept 2001, which was also the 38% retracement of that move. Awesome.
Attachments
FTSE Beater
Experienced member
- Messages
- 1,518
- Likes
- 6
Hi all.
I still need convincing on the issue of Fibonacci with shares, I've seen it clearly work on the Dow and I have no problems with the concept.
Take the example of Kier finding Support at 395, it had already been strong resistance before, so I believe the retracement to 38% was merely a Support and Resistance switch.
I would love to be proved wrong on this, but as yet I still need to be convinced.
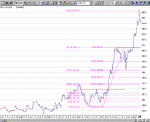
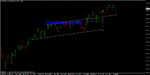
Hi FTSE Beater - Surely the key point here is that the 395 support level was previous resistance at the 161.8% projection for KIE, and was determined in May 2000. So the support at 395 was caused by a Fib level. The next projection was 261.8%, and 38.2% retracement from there took KIE back down to the previous resistance (now support) at a key Fib level.
And how do you account for the next extension running to the next Fib level at 423.6% at 670. Not coincidental surely?
I would agree tho' that suport or resistance at key Fib levels is more powerful if there is evidence of previous S/R at that level. I'm always looking for independent confirmation.
And how do you account for the next extension running to the next Fib level at 423.6% at 670. Not coincidental surely?
I would agree tho' that suport or resistance at key Fib levels is more powerful if there is evidence of previous S/R at that level. I'm always looking for independent confirmation.
FTSE Beater
Experienced member
- Messages
- 1,518
- Likes
- 6
Hi Roger
I had heard that Fib no.s go beyond the 100% mark, but I've never seen it in action before (I didn't see the 1st set of Fib no.s), so thank you very much for pointing this one out. 🙂
I've had a quick look at other random charts to see if it runs true with others, and it does seem to run true, especially for picking break-out targets. I'm still not 100% convinced, but having said that if a share breaks-out and stops at a Fib level and starts to reverse, I'll pull the trigger there.
Last edited:
The power of Fibonacci? My jury's still out on this one - maybe it's because I don't have access to an online auto-chart calculator!
So I created a spreadsheet which would allow me to enter a range and it gives the fib projections.
Anyway, my point is that tonight I entered in the range from the September low (8062) and the previous high (11350) and it threw up a 61% retracement figure of 10093 from that low.
Then I entered in the more recent low (9503) and high (10683) and it came up with a 50% retracement figure of 10093 from that low.
What might this imply? Or is it just a coincidence?
Priceman
Established member
- Messages
- 757
- Likes
- 84
For Wasp...fibtastic action!
Now I know there are a lot of people who don't believe the hype but I am a follower of fibs and do rate them more than a lot of other indicators. That's not to say I don't use other indicators, but as with all things that's just what they are; indicators, meaning I use them as guidelines not laws to abide by always. As I am mainly an FX trader then I've concentrated on that for this exercise. If I have time over the weekend I'll add some charts for indices like DAX and DOW.
My chosen subject for the exercise is cable and unfortunately it's gone ballistic at the moment and I don't have charts that go back far enough to see previous support/ resistance levels from 26 years ago. This is making things a little more difficult for me to predict where cable may go but I'll just go with the trend till it's end 🙄 yukky quote I know, so tacky!
Maybe Socrates is a secret fib follower when he states 'everything is know in advance'... 😉 It certainly does seem this way when you see how fib levels can work. Maybe he'll post some wise words to help this exercise along to prove how things are known before the event.
The charts show where moves went and how they adhered to fib levels. I know there can be 'fitting' of levels after the event but what I am trying to do is use them to predict what 'could' happen in the near future. Obviously when a move gets going it does take some stopping to reverse it (wonder if anyone knows exactly how much money comes into cable for instance to stop it dead in it's tracks and reverse? $10mill, $20mill, $100mill?) if there is strength in that move. This means that sometimes prices runs on past the fib level before retracing.
Next problem with fibs is how to decide what the important price levels are, on which to place the 0% start and 100% finish levels. Here I am trying to look for where the big institutions come in to move the price and how far they take it before changing it's direction. I start with the larger timeframes like daily or weekly then move down to hourly. I finish the fib useage there on the hourly and go to 5 minutes to look for possible future support/ resistance levels. In up moves I am looking at retracements and take the low of the retracement to the previous high, then extend the fib to the 161% level. In down moves I look for the inverse; ie the high retracement to the low and extend the downmove fib level. Hope that's clear? With the charts I think it should be.
On my fibonacci levels I use the 78.6% level which a lot of others don't use. I do remember also seeing 76.4% I think, so this marker is maybe a bit less useful than the usual 23.6%/ 38.2%/ 50%/ 61.8%. I'd be interested on views here too.
Also as price 'value' changes every day/ hour/ minute depending on the fundamentals and economics behind the chosen market the fib levels need to be adjusted to go along with the change in sentiment towards that market.
Maybe other fib fans can add some charts for discussion. Let's hope at least I can get Wasp to consider looking at them as useful indicators! :cheesy:
Attachments
Lightning McQueen
Moderator
- Messages
- 5,030
- Likes
- 843
Nice post priceman, I do hope it generates discussion.
Rather than use all the levels I go for one only, if supported by the charting software. For me im quite taken with the 61.8% level, using this to detect failures to drive prices higher or lower, I have currently lost the source of this strategy, when found I will post a chart illustrating the point. Will Dow be ok?
As for unbelievers, well once a sceptic, always a sceptic, I dont believe peeps change their views, unless of course someone comes up with a foolproof strategy based on fibs & posts it...which could be foolhardy but thats another subject...then watch the leopards change their spots, quick smart.
I don't believe we will ever know what he's thinking or up to, for if anyone actually comes up with the right post sussing it all and taking away the hobby horse, they will be severely dealt a "no thats not it" reply, swiftly transported by "beyond right hard edge" technology to a galaxy far, far away known as "yonder place" put in a chamber, stripped of all worthwhile trading knowledge, weened off current diet of banana, then let loose in the wild to rant about the place they've just left...hmm, nice.😱 😆
Rather than use all the levels I go for one only, if supported by the charting software. For me im quite taken with the 61.8% level, using this to detect failures to drive prices higher or lower, I have currently lost the source of this strategy, when found I will post a chart illustrating the point. Will Dow be ok?
As for unbelievers, well once a sceptic, always a sceptic, I dont believe peeps change their views, unless of course someone comes up with a foolproof strategy based on fibs & posts it...which could be foolhardy but thats another subject...then watch the leopards change their spots, quick smart.
Maybe Socrates is a secret fib follower when he states 'everything is know in advance'... 😉 It certainly does seem this way when you see how fib levels can work. Maybe he'll post some wise words to help this exercise along to
prove how things are known before the event.
I don't believe we will ever know what he's thinking or up to, for if anyone actually comes up with the right post sussing it all and taking away the hobby horse, they will be severely dealt a "no thats not it" reply, swiftly transported by "beyond right hard edge" technology to a galaxy far, far away known as "yonder place" put in a chamber, stripped of all worthwhile trading knowledge, weened off current diet of banana, then let loose in the wild to rant about the place they've just left...hmm, nice.😱 😆
Nice post priceman, I do hope it generates discussion.
Rather than use all the levels I go for one only, if supported by the charting software. For me im quite taken with the 61.8% level, using this to detect failures to drive prices higher or lower, I have currently lost the source of this strategy, when found I will post a chart illustrating the point. Will Dow be ok?
As for unbelievers, well once a sceptic, always a sceptic, I dont believe peeps change their views, unless of course someone comes up with a foolproof strategy based on fibs & posts it...which could be foolhardy but thats another subject...then watch the leopards change their spots, quick smart.
I don't believe we will ever know what he's thinking or up to, for if anyone actually comes up with the right post sussing it all and taking away the hobby horse, they will be severely dealt a "no thats not it" reply, swiftly transported by "beyond right hard edge" technology to a galaxy far, far away known as "yonder place" put in a chamber, stripped of all worthwhile trading knowledge, weened off current diet of banana, then let loose in the wild to rant about the place they've just left...hmm, nice.😱 😆
Howdy!
Look at a chart, LM. Look where price stops, where indicators are not, because price has not been there yet, the void, the future, the unknown, a mythical place of Black Swans and where pots of gold lie in wait....
Seems void of information doesn't it?
It's full of information.
Unfortunately, you are not allowed to view this info, and niether is Soccy.
All things fit sometimes, what a folly eh?
Sorry for ranting, LM. 🙂 .
Maybe other fib fans can add some charts for discussion. Let's hope at least I can get Wasp to consider looking at them as useful indicators! :cheesy:
good post priceman. i have never considered them indicators myself, but guess that is a different discussion.
I like them for targets on measured moves, but not so much for retracements.....although at times they seem to be good. My preferred use for retracements are as a complement of other events and used more as a confluence (i.e. say, a retrace gets to a 61% where price has happened to print a congestion, or a hammer, etc.)
j
edit....look at the example for euryen....breakout, pullback to 50% but also to previous resistance.....so which was it, 50% or resistance turned support........i dont want to answer that. but see it as a confluence of events
Attachments
Last edited:
Joules MM1
Established member
- Messages
- 648
- Likes
- 142
...........
Also as price 'value' changes every day/ hour/ minute
This is a follow-on post from todays private discussion with Priceman:
essentially, I now have more ammunition to disprove the veracity and contiguous draw-ups versus DD and thus am able to better disprove the validity of the fibonacci employment as a live trading tool........by this I mean the probability of achieving higher DD to DU is prohibitive unless the trader intends to follow a strategy of purest linear entrances and exits ........this does not suit the way I now trade.......having said that, there are times when I'll look for inverse fib ratios in retracements (in minuette and minor degree levels) and this is to assist in the proof that the move I am seeing is part of a larger move that I have already interpreted rather than to use as mechanism of itself........proving structure if nothing else and only at lower edgrees of trend
At the end of the day, imo, Fibonacci is a marvel in proving the concept of fractal robustness and the confluence of pattern structure as part of a thesis or paper on limbic systems ........beyond that, the truth is, for me, that; that empiric knowledge aside, the unfurling of a pattern does not await confirmation of a fibonacci, however, the Fibonacci does require confirmation from the pattern which is then (already) complete and not available for trade to enter .........and if I am already in pos then I hardly depend on a Fibonacci signal to exit ............
so, while that sounds a tad contradictory, because I still look for inverted Fibonacci ratios in zigzags, I do not depend on them as a signal as a Fibonacci acts as a magnet (in interpretation) and a resistance (in interpretation) and a support (in interpretation) ........as I then must use other knowledge to expand on the validity of entering or exiting on that Fibonacci signal, then, that means I would get that signal else-where, regardless............therein the tool does not actually prove that I can lift my level of risk protection. Fibonacci can actually lift risk levels, make a trader aggressive, when a trader places such a priority that that priority distracts and detracts from other key signals..........remember, this is my pov and I am not stating this as an implicit, or to be so.
I hope that is clear enough an explanation.
While I am satisfied that most of my past Fibonacci posts contain valuable information and should have been left in (T2W), I now think that to repost them maybe misleading given what Ive just said and the way I conduct business.
While I used to argue that Fibonacci carry probability, they do not intrinsically carry enough risk profile, rather, they carry a sense of "feeling" that permission is given by a regime.........any live futures trader must know that to trade purely "off" fibonacci takes an understanding and discipline that requires pristine application and I can tell you now that few traders (ever) have the ability to conduct such a pristine application and remain cognizent of what is really unfolding at critical stages of sessions.........
A good example might be that friday was a critical Fibonacci turn-date, yet, there have been a plethora of such turn-dates when nothing but continuity occurred ............so a trader would have exited or entered on that signal if no other regimen is relied upon as a signal for action.........this clearly would lead to a string of DD and an (as yet) unknown DU which may or may not be 1 or two sessions ..........take this and apply it to say the 1.618 extension of each move.......we need to know what relative size to apply and what relative size should we enter and exit on and which other extensions should take action on at the same time.........(aside from the passing the level figured)we then need to take into account what other signals would override the Fibonacci ratio as being a magnet or S/R and this brings up the question of whether that need to see and prove other signals then immediately invalidates or lessens the value of the ratio we expect to see occurr (not yet proven in the live trade)
how many times have I seen fibonacci levels get hit retrace fractionally and then revert to the one-larger degree trend? Very often is the answer. You see the inherent challenge with this? Stop, start........stop, start and all the while distracting from what is really unfolding, in realtime...........
Clearly trading on Fibonacci is not satisfactory for me and I know that I need to exapnd much more on this so as not give the inappropriate bias .........
I am adament of one thing; that there is no such thing as trading "on" Fibonacci or "by" Fibonacci .........any one who says that that is what they do is likely fooling themselves or selling a package ( this is not to be confused with Elliotts waves, which is not what I am talking about)........after trading "by" and "on" most trader come to realise that once they remove the Fibonacci side-track, that, the other understanding they require, is the technical knowledge that had priority, yet, they did not view that as such, because they were driven to "see" value in someting that is not immediately, necessarily, inviting the trader to think through the procing process ( and that area is a whole different emphasis).
to summarise and yes, I know, there is much to discuss and much time needs to be spent, on this subject, so that you can take the parts that you can use and the parts that you can place into appropriate perspective.........or, the bits that work as a ratio to the parts that rarely, if ever, "work" and produce consistant-enough results
I rebuke people who have not empirically studied the efficacey of Fibonacci and then they go on to "slag" the subject and I also carry a very strong urge to yell at someone who blindly rambles about the value of this math.
......... especially where the emphasis of a stratgey is based on Fibs, validity in the employ of Fibonacci must be done in realtime not in hindsight.
Experience has shown me that during mild periods of retracement in an impulsive set in some futures markets the 78.6 (sqr root of 61.8) is a common magnet while in other similar phases 66% is the draw and when I am expecting the 1.618 to be hit the 150 mark sees a turnaround........I am not implying that there is a level of guesswork.........I am implying that some markets at some times in some sell-downs and some buy-ups, some ratios are common ...........so the question isnt does Fibonacci work, the question is which one and how much is the trader prepared to rely given that the risk level is very high and the entrance and exits are linear when employed this way........there are so many ratios available and all of them are active........like Elliotts waves......all waves are active at the same time......the question is extent.........the trader is locked in by the system that needs to be designed to best keep the risk level at its lowest.........this has little to do with new players who enter and alter the unfurling live action........I am alluding to the distraction here......and while Fibonacci do unveil limbic properties I doubt that the average trader is ever going to learn that area of natural science.
In the area of geometric structures which include Fibonacci measures, yes, these are as much an art, of interpretation, as they are a foward-looking (expectant) science in motion.
In a live set-up, you must ask, which ratio is in action at which level. You must ask, is the ratio truly a Fibonacci or a Lucas or a geometric and the numbers arent the key because the point of the ratio is to ratify the active impulsion of Phi .........well, you don't know and you are being asked to look, keep looking and while youre doing that youre not looking at other areas which may require your attention......these are often the areas that are going to give you the real and immediate key you need to see.
trading is not a science field-trip........
let me know which parts of this you want me to exapnd on and please accept that for me to fully expand on the pitfalls and advantages I would need to do that ina live set-up.
Julian
Priceman
Established member
- Messages
- 757
- Likes
- 84
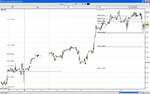
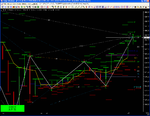
DOW and DAX
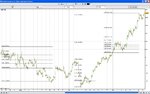
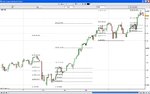
Now looky here then... I don't really know much about the DAX and DOW but just look how the DOW hits fibs left right and centre! Question now is where is it going? Is it in retrace before the next move up or is it down down DOW from now? I have just started dabbling with the DAX with some success but not using fibs. Maybe this week I'll look to see if they play a part in any moves, I'll also try to put my thoughts on before they happen (now that could be really embarassing couldn't it! 😱 )
I'll have a go at posting my thoughts for the direction on each of the charts if others would like to do the same...
Be good to get some other insights out there in some meaty discussions. Be they pro or con fibs, that's what I am hoping to achieve. I'm not looking for the holy grail just another part to the armour.
Thanks Jules for your input so far, great detail
Attachments
wasp
Legendary member
- Messages
- 5,107
- Likes
- 880
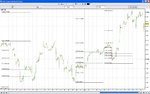
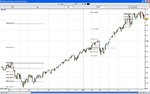
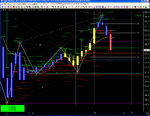
I will reply in more detail later but here is a quick play with the first chart Priceman and how S/R and trendlines give exactly the same indications of possible retracements, reversals, highs and lows.
More to come later...
Actually, I'm not really sure there is anymore to say... The chart speaks for itself as do the trendlines and support and resistance. I guess its a kind of "what comes first..." question. Both work and both do the same thing and tell you the same thing so which to use doesn't matter in itself but personally, I will always be inclined to go with the S/R and TLs first as I personally believe that more big money look at them than Fibonacci. For me, being as closely in sync with those that move the market is paramount, but maybe I'm wrong and it really is the other way round.
Attachments
Last edited:
I will reply in more detail later but here is a quick play with the first chart Priceman and how S/R and trendlines give exactly the same indications of possible retracements, reversals, highs and lows.
More to come later...
seems familiar to this one
http://www.trade2win.com/boards/showpost.php?p=346883&postcount=114
rols
Experienced member
- Messages
- 1,621
- Likes
- 336
I will reply in more detail later but here is a quick play with the first chart Priceman and how S/R and trendlines give exactly the same indications of possible retracements, reversals, highs and lows.
More to come later...
Actually, I'm not really sure there is anymore to say... The chart speaks for itself as do the trendlines and support and resistance. I guess its a kind of "what comes first..." question. Both work and both do the same thing and tell you the same thing so which to use doesn't matter in itself but personally, I will always be inclined to go with the S/R and TLs first as I personally believe that more big money look at them than Fibonacci. For me, being as closely in sync with those that move the market is paramount, but maybe I'm wrong and it really is the other way round.
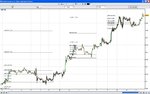
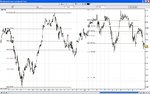
Here's something from today....
I like the idea of dynamic fibs combined with S+R on an hourly chart with no indicators though I do have a squeeze (yellow bars) on the second chart.
First chart gave me a short. Second chart confirmed.
Attachments
Similar threads
- Replies
- 212
- Views
- 57K
- Replies
- 16
- Views
- 7K
- Replies
- 2
- Views
- 7K