ppplaci
Active member
- Messages
- 133
- Likes
- 6
Day 20 (Week 4)
Month's plan beginning balance: £50
daily target is 5% (£2.50)
base stake: £0.1/tick
max stake £0.8/tick
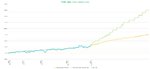
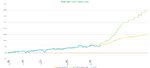
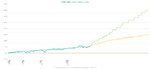
Account start balance: £50.00 (on 21 July 2014)
Current balance: £106.50
Account profit(net return):
plan: 100%
actual: 113%
Win/Lose days: 19/1
Win/Lose trades: 105/96
********************************************
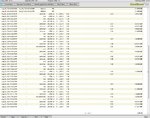
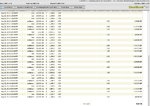
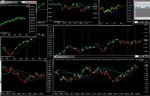
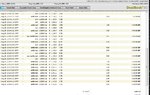
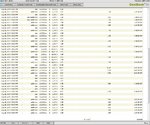
Horrible day. First losing day After all that speech about having control etc. I almost finished with target in the first hour. Then I entered into a trade with YM. Too high risk, bad decision, meltdown.
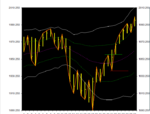
Because of previous days performance still up compared to plan, so I consider first month finished. My mother is here so it is not the same to trade, I shouldn't even have started trading. Very slow market, I was in the long at a perfect place but exited early, and missed the continuation. Made a screenshot of the chart, will try to mark the trades tomorrow but too tired now been looking at charts all day moving horizontally.
Good part is I only lost £3.60 altogether, but lost £11 on the YM which means I am way up on Russell. Just have to stick with it.
Month's plan beginning balance: £50
daily target is 5% (£2.50)
base stake: £0.1/tick
max stake £0.8/tick
Account start balance: £50.00 (on 21 July 2014)
Current balance: £106.50
Account profit(net return):
plan: 100%
actual: 113%
Win/Lose days: 19/1
Win/Lose trades: 105/96
********************************************
Horrible day. First losing day After all that speech about having control etc. I almost finished with target in the first hour. Then I entered into a trade with YM. Too high risk, bad decision, meltdown.
Because of previous days performance still up compared to plan, so I consider first month finished. My mother is here so it is not the same to trade, I shouldn't even have started trading. Very slow market, I was in the long at a perfect place but exited early, and missed the continuation. Made a screenshot of the chart, will try to mark the trades tomorrow but too tired now been looking at charts all day moving horizontally.
Good part is I only lost £3.60 altogether, but lost £11 on the YM which means I am way up on Russell. Just have to stick with it.
Attachments

Last edited: