Elliott Wave EUR/USD

Hi JahDave

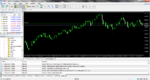
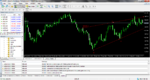
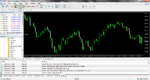
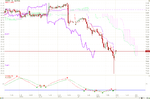
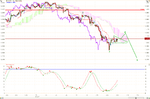
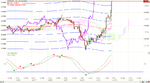
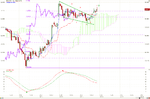
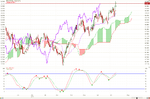
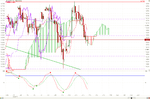
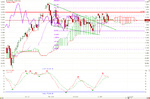
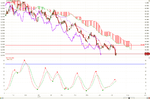
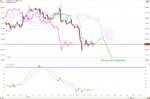
Without doubt the eur/usd on the wkly is heading to somewhere around 1.1950 area, my wkly chart shows we are on wave 5, only problem is when? We have abc patterns on the 4hr/daily timeframes to contend with first so I do not see it crashing next week when we have 4hr/daily timeframes showing a strong uptrend for next week.

So how or what does one use to determine the when, would that be the stochs, the fibs, ma's, macd or semaphors? What do you use to determine when, do you wait for a pattern on the lower timeframe i.e., a daily abc short?

Good luck with your next competition, great result (y) Curious as to how many entered it, who came first anyway?
 

Attachments

  • MetaTrader 5DAILY.png
    MetaTrader 5DAILY.png
    147.9 KB · Views: 154
  • MetaTrader 5wkly.png
    MetaTrader 5wkly.png
    154.2 KB · Views: 163
  • MetaTrader 54HRLY.png
    MetaTrader 54HRLY.png
    152.5 KB · Views: 175
My guess for EUR is that it is at the end of a big triangle abcde and ready to explode to a final wave. :-0
 
Can someone be specific, exactly when, to the minute, call a trade buy / sell etc!! Anyone can give a 100 pip slide!!
 
Some interesting posts here as usual :)

I've placed a minimal risk short on and will leave on overnight, if i wake up and i've
not been stopped then i'm happy to hold it for a while as i think its time to go down :clover:
 
Can someone be specific, exactly when, to the minute, call a trade buy / sell etc!! Anyone can give a 100 pip slide!!

Trading is like going to the casino............The only difference is that you can chart the performance here, and there are repeatable patterns that happen....... So if you have a good system then you have an advantage over most traders................ If you were to look at the daily charts, the hourly charts, the 5 minute charts, and the 1 minute charts,,,,,,,,,,,,,,,,,,,,,,and everything lines up perfect across all 4 time frames, then I would say you could call the trade within 1 or 2 minutes,,,,,,,,,,,,,,but I have never seen such a line up,,,,,,,,,and I don't watch the 1 minute charts.........And anyone cannot call a 100 pip slide,,,,,,because most traders lose money in the long term..............
 
Nice, i opened up another position early this morning.... between the two i closed when i hit a total of 100 points (y)

I'd hold longer but from previous experience i like to TP as i have a habit of giving profits back to the markets :eek:
 
Trading is like going to the casino............The only difference is that you can chart the performance here, and there are repeatable patterns that happen....... So if you have a good system then you have an advantage over most traders................

This aspect is probably what makes trading appear "easy" to most people. I have to admit that I didn't know what all the fuss was about until I cracked a book.

I believe I looked something like this: :eek:.
 
Nice, i opened up another position early this morning.... between the two i closed when i hit a total of 100 points (y)

I'd hold longer but from previous experience i like to TP as i have a habit of giving profits back to the markets :eek:

I'm glad you did well Doom. If I have counted correctly and the USD_JPY bottomed out and is going up a while now.
 

Attachments

  • USD_JPY_07_12_hour.png
    USD_JPY_07_12_hour.png
    42.6 KB · Views: 160
Here is my current 1 hour Euro chart.
 

Attachments

  • EUR_USD_07_13_Hour.png
    EUR_USD_07_13_Hour.png
    53.4 KB · Views: 192
Re: Kiwi Ichimoku charts

Here is a 5 minute, 1 hour, and 1 day NZD_USD Ichimoku chart. The daily shows no sign of weakness yet. There is a spike on the last 1 hour candle, and there is a gap under that candle as well. The highest probability is that the gap will close and hold support. On the five minute chart there is a nice shooting star to end the trading day. So it looks like there will be some down to start the week, but it will probably move up to new highs after that.

Good Trading,
JahDave

I am selling the Kiwi. It had its run down at the first of the week, and now it has made new highs straight up.......
 

Attachments

  • NZD_USD_07_13_2011.png
    NZD_USD_07_13_2011.png
    33.7 KB · Views: 138
If you have read my thread for the last several months then you know that i have been calling for USD strength across the board..........Even though I have been following the shorter term charts and posting against the USD when the charts showed weakness.....................Here is the deal...............Looking at the 5 minute charts,,,,,,,and based on the hour and the daily charts,,,,,,,,,,,,,,,I think that the USD has bottomed out on the second wave across the board.......................This means that we should see a lot of USD strength in the upcoming months.............There will be dips, and there could possibly one more move against the USD,,,,,,But even at that we are talking about a multi year reversal here and huge gains............
 
I don't know what is going to happen in Switzerland, but the CHF is going down across the board, along with the JPY................
 
The Usd is looking like it will be strength trade for a while from here.................
 
I reckon that the Kiwi has had its fun for now and will be going down the first part of next week........That is funny because that is the same forecast as last weekend.......The implications here are larger than last week because If I have counted the leading diagonal correctly on the 1 hour chart then wave 1 is complete and wave 2 is probably complete as well. I will be selling this pair at the markets open and watching the down move that I think is coming..........If this is a wave 3 starting like I think it is, then the selling pressure should be very strong the first 2 or 3 days of the trading week. It should not go above the shooting star on the day charts and it finished the week on the hour chart with a doji.......Both of these are good sell signals........

Good Trading,
Dave
 

Attachments

  • NZD_USD_07_15_2011_Hour.png
    NZD_USD_07_15_2011_Hour.png
    41.4 KB · Views: 131
  • NZD_USD_07_15_2011_Day.png
    NZD_USD_07_15_2011_Day.png
    53.1 KB · Views: 126
Last edited:
The Aussie looks like it went up 5 and then down 5.............That is a very good clue for a long term reversal.........That also means that there should be a 3 wave correction to start the week.......The other scenario is that there will be an extended fifth wave down to start the week............I am not trading this pair to start the week,,,,,,,,but I will be looking to get in later this week or next week for some big gains...........
 

Attachments

  • 07_15_2011_3_Hour.png
    07_15_2011_3_Hour.png
    47.3 KB · Views: 126
  • 07_15_2011_Day.png
    07_15_2011_Day.png
    46.3 KB · Views: 104
Here is the USD_CHF update..........I thought this pair had bottomed out several weeks ago, but now I think I missed one wave down........I also think that this last wave down will not be very large because the first wave down in this last move was not very large.............I think that we are seeing a bottom of a 10 year down trend so, that means the initial movements up will probably be pretty small for the next several months, but from a long wave Elliott Wave Perspective, this reversal is imminent........
 

Attachments

  • USD_CHF_07_15_2011_Day.png
    USD_CHF_07_15_2011_Day.png
    54 KB · Views: 119
  • USD_CHF_07_15_2011_3_Hour.png
    USD_CHF_07_15_2011_3_Hour.png
    42.6 KB · Views: 129
I'm having trouble opening the screen with the charts. I tried to double click on the "cross" and also right click and "open picture" but nothing worked. Any suggestions?
Thanks
 
Top