Elliot Wave Analysis by Solid ECN

SOLIDECN

Senior member
Messages
2,800
Likes
0
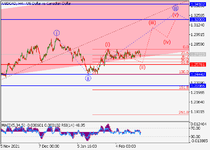
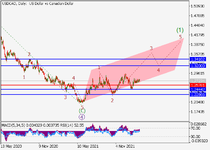
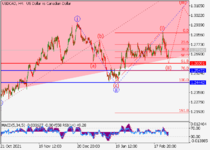
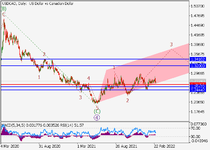
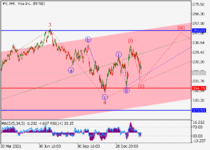
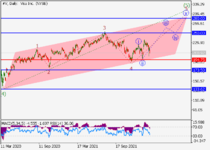
USDCAD pair is in a correction and may grow.
On the daily chart, the first wave of the higher level (1) of 5 forms, within which the wave 3 of (1) develops. Now, the third wave of the lower level iii of 3 is developing, within which the wave (i) of iii has formed, and a local correction is ending as the wave (ii) of iii. If the assumption is correct, after the end of the correction, the pair will grow to the levels of 1.3200–1.3410. In this scenario, critical stop loss level is 1.2578.​

usdcad_1.pngusdcad_2.png
 
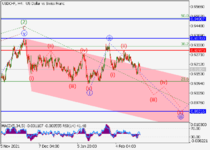
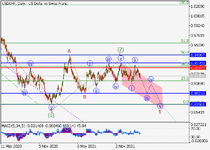
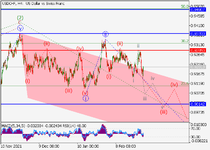
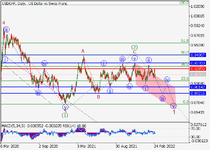
USDCHF, The pair may fall.

On the daily chart, the first downward wave of the higher level (1) of 3 formed, an upward correction developed as the second wave (2) of 3, and the development of the third wave (3) of 3 started. Now, the first wave of the lower level i of 1 of (3) has formed, the local correction ii of 1 of (3) has developed, and the wave iii of 1 of (3) is forming, within which the wave (iii) of iii is developing. If the assumption is correct, the pair will fall to the levels of 0.8921–0.8758. In this scenario, critical stop loss level is 0.9297.​

usdchf_1.pngusdchf_2.png
 
Elliot Wave Analysis by Solid ECN Securities


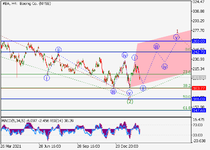
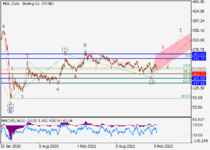
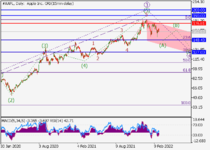
Boeing Co. wave analysis | The price may grow.
On the daily chart, the first wave of the higher level (1) of C formed, and a correction developed as the second wave (2) of C, and the development of the third wave (3) of C started. Now, the first entry wave of the lower level 1 of (3) is forming, within which the wave i of 1 has formed, and the wave ii of 1 is ending. If the assumption is correct, the price will grow to the levels of 242.70–260.00. In this scenario, critical stop loss level is 183.77.​

ba_1.pngba_2.png
 
Elliot Wave Analysis by Solid ECN Securities


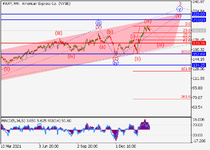
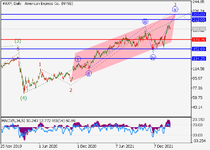
American Express Co | The price may grow
On the daily chart, the fifth wave of the higher level (5) develops, within which the wave 3 of (5) forms. Now, the fifth wave of the lower level v of 3 is developing, within which the wave (iii) of v has formed. If the assumption is correct, after the end of the local correction (iv) of v the price will grow to the levels of 210.00–220.00. In this scenario, critical stop loss level is 170.76.​

axp_1.pngaxp_2.png
 
Market update by Solid ECN


WTI Crude Oil, "black gold" rushed to new highs
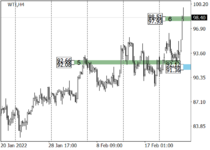
Against the backdrop of the start of a military operation announced by the Russian authorities in Donbas, the price of Crude Oil shows an uptrend in trading. Interest in risky assets is rapidly falling, as investors expect the situation on the Ukrainian borders to worsen.

Against this background, the quotes of "black gold" reach new highs around $99 and approach the level of $100. If the military conflict develops, the price may rush to the levels of $110 – $115.

The US President Joe Biden announced the imposition of sanctions against the operating company Nord Stream 2 and its corporate executives, and also announced the US readiness to take further steps in the event of an escalation of the situation around Ukraine. The rhetoric of the head of the White House raises concerns among investors about a possible shortage of energy resources due to growing global demand, and, as a result, leads to an increase in the price of oil and its products.

Meanwhile, the EU authorities are also expanding the package of sanctions measures against Russian companies and individuals, which pushes energy prices up and could lead to an increase in quotations to $150 per barrel.

De-escalation of tension around Ukraine is not yet expected, so a breakdown of the level of $100 is most likely. The next growth target will be at #105. Investors will continue to follow geopolitical situation, which is now coming to the fore.

Support and resistance
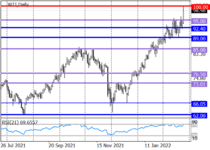
The long-term trend is upward. Today, the price of the asset tested 99.00, approaching as close as possible the level of $100, the breakdown of which, as well as fixing the price above it, will most likely reach the next target in the area of $105.

As part of the medium-term uptrend, the oil price reached the target zone 6 (98.51–97.93). A breakout of this area and consolidation of the price above it will lead to an increase in prices towards the area of the target zone 7 (104.36–103.78). Key support is shifting to 92.12–91.36.

Resistance levels: 100, 105, 110.
Support levels: 95, 92.4, 89.​

oil_1.pngoil_2.png
 
Elliot Wave Analysis by Solid ECN


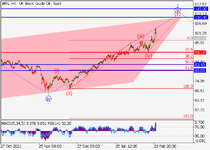
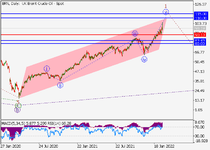
Crude Oil, The price may grow.
On the daily chart, the upward wave C forms, within which the first wave 1 of (1) of C develops. Now, the fifth wave of the lower level v of 1 is forming, within which a local correction has ended as the wave (iv) of 1, and the wave (v) of 1 is developing. If the assumption is correct, the price will grow to the levels of 110.00–115.00. In this scenario, critical stop loss level is 90.13.​

oil_1.pngoil_2.png
 
Elliot Wave Analysis by Solid ECN


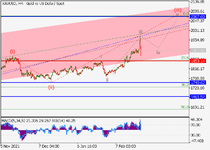
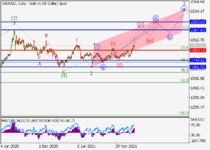
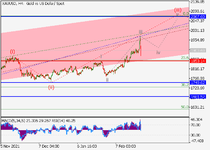
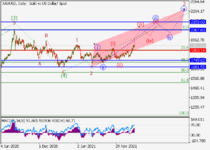
Gold may grow.
On the daily chart, the fifth wave of the higher level (5) develops, within which the wave 3 of (5) forms. Now, the third wave of the lower level iii of 3 is developing, within which the wave (iii) of iii is forming. If the assumption is correct, the pair will grow to the levels of 2067.60–2150.00. In this scenario, critical stop loss level is 1853.14.​

gold_1.pnggold_2.png
 
Elliot Wave Analysis by Solid ECN Securities


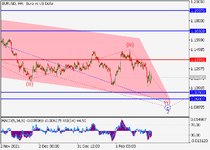
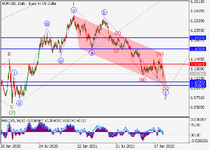
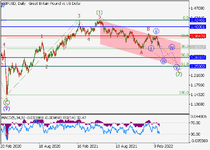
EURUSD pair may fall.
On the daily chart, the first wave of the higher level 1 of (3) formed, and a downward correction develops as the second wave 2 of (3), within which the wave c of 2 forms. Now, a local correction has ended as the fourth wave of the lower level (iv) of c, and the fifth wave (v) of c is developing. If the assumption is correct, the pair will fall to the levels of 1.1050–1.0980. In this scenario, critical stop loss level is 1.1393.​

eurusd_1.pngeurusd_2.png
 
Elliot Wave Analysis by SolidECN


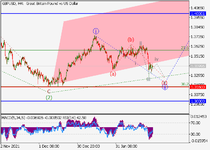
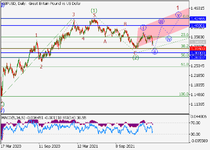
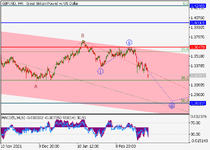
GBPUSD is in a correction and may grow.
On the daily chart, the first wave of the higher level (1) formed, a downward correction developed as the wave (2), and the development of the third wave (3) started. Now, the first entry wave of the lower level i of 1 of (3) has formed, and a local correction is ending to develop as the second wave ii of 1, within which the wave (c) of ii is forming. If the assumption is correct, after the end of the correction, the pair will grow to the levels of 1.4000–1.4246. In this scenario, critical stop loss level is 1.3160.​

gbpusd_1.pnggbpusd_2.png
 
Elliot Wave Analysis by Solid ECN


USDCAD may grow.
On the daily chart, the first wave of the higher level (1) of 5 forms, within which the wave 3 of (1) develops. Now, the third wave of the lower level iii of 3 is developing, within which the wave (i) of iii has formed, and a local correction has ended as the wave (ii) of iii. If the assumption is correct, the pair will grow to the levels of 1.3200–1.3410. In this scenario, critical stop loss level is 1.2609.​

usdcad_1.pngusdcad_2.png
 
USDCHF pair may fall.

On the daily chart, the first downward wave of the higher level (1) of 3 formed, an upward correction developed as the second wave (2) of 3, and the development of the third wave (3) of 3 started. Now, the first wave of the lower level i of 1 of (3) has formed, the local correction ii of 1 of (3) has developed, and the wave iii of 1 of (3) is forming, within which the wave (iii) of iii is developing. If the assumption is correct, the pair will fall to the levels of 0.9014–0.8921. In this scenario, critical stop loss level is 0.9285.​

usdchf_1.pngusdchf_2.png
 
Elliot Wave Analysis by Solid ECN


Visa Inc, The price may grow.
On the daily chart, the fifth wave of the higher level (5) develops, within which the third wave 3 of (5) formed, and a downward correction developed as the fourth wave 4 of (5). Now, the fifth wave of the lower level 5 of (5) is developing, within which the wave iii of 5 is forming. If the assumption is correct, the price will grow to the levels of 250.00–280.00. In this scenario, critical stop loss level is 194.75.​

visa_1.pngvisa_2.png
 
Elliot Wave Analysis by Solid ECN


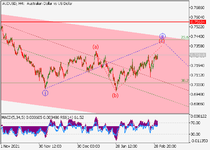
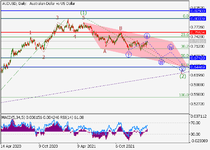
AUDUSD is in a correction, a fall is possible
On the daily chart, the first wave of the higher level (1) of C developed, and a downward correction forms as the wave (2) of C, within which the wave C of (2) develops. Now, the first wave of the lower level i of C formed, and a local correction is ending to develop as the wave ii of C, within which the formation of the wave (c) of ii is ending.

If the assumption is correct, after the end of the correction, the pair will fall to the levels of 0.6742–0.6446. In this scenario, critical stop loss level is 0.7563.
 

Attachments

  • audusd_1.png
    audusd_1.png
    18.8 KB · Views: 58
  • audusd_2.png
    audusd_2.png
    21.1 KB · Views: 59
Elliot Wave Analysis by Solid ECN


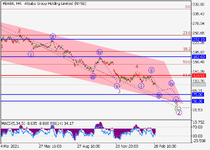
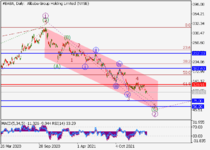
Alibaba Group Holdings Ltd, The price may fall.
On the daily chart, the first upward wave of the higher level 1 formed, and a downward correction develops as the wave 2. Now, the wave © of 2 is forming, within which the development of the fifth wave of the lower level 5 of © has started.

If the assumption is correct, the price will fall to the levels of 75.00–56.00. In this scenario, critical stop loss level is 128.91.

alibaba_1.pngalibaba_2.png
 
Elliot Wave Analysis By Solid ECN


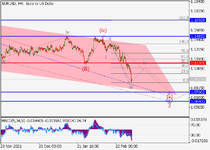
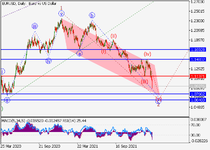
EURUSD pair may fall.
On the daily chart, the first wave of the higher level 1 of (3) formed, and a downward correction develops as the second wave 2 of (3), within which the wave c of 2 forms. Now, a local correction has ended as the fourth wave of the lower level (iv) of c, and the fifth wave (v) of c is developing.

If the assumption is correct, the pair will fall to the levels of 1.0760–1.0640. In this scenario, critical stop loss level is 1.1137.

eurusd_1.pngeurusd_2.png
 
Elliot Wave Analysis By Solid ECN


GBPUSD is in a correction, a fall is possible.
On the daily chart, the first wave of the higher level (1) formed, and a downward correction develops as the wave (2). Now, the wave and of (2) has formed, a local correction has developed as the second wave B of (2), and the wave C of (2) is forming, within which the wave iii of C is developing.

If the assumption is correct, the pair will fall to the levels of 1.2833–1.2500. In this scenario, critical stop loss level is 1.3647.

gbpusd_1.pnggbpusd_2.png
 
Elliot Wave Analysis By Solid ECN


Apple Inc price is in a correction, a fall is possible.
On the daily chart, the third wave of the higher level 3 develops, within which the wave (5) of 3 formed, and a downward correction develops as the fourth wave 4. Now, the wave (A) of 4 is forming, within which the wave 5 of (А) is developing.

If the assumption is correct, the price will fall to the levels of 148.43–127.03. In this scenario, critical stop loss level is 176.81.

apple.png
 
Elliot Wave Analysis By Solid ECN


Microsoft Corp is in a correction, a fall is possible.
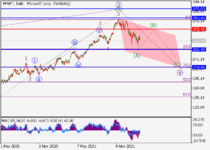
On the daily chart, the third wave of the higher level 3 developed, within which the wave (5) of 3 formed, and a downward correction develops as the fourth wave 4. Now, the wave (А) of 4 has formed, within which the fifth wave of the lower level 4 of (A) has ended, and the wave (B) of 4 is developing.

If the assumption is correct, after the end of the correction, the price will fall to the levels of 266.40–219.45. In this scenario, critical stop loss level is 320.45.

microsoft.png
 
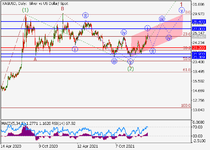
Silver may grow.


On the daily chart, the first wave of the higher level (1) of 3 formed, and a downward correction developed as the wave (2) of 3, within which the wave C of (2) formed. Now, the development of the third wave (3) of 3 has started, within which the first wave of the lower level i of 1 of (3) formed, a local correction has started to develop as the wave ii of 1 of (3).

If the assumption is correct, after the end of the correction, the price will grow to the levels of 27.00–28.40. In this scenario, critical stop loss level is 23.2.

silver.png
 
Top