Perfect Wave - 2012-1/2

Quote from Wide Tailz:

For similar reasons, I have a lot against fundamental analysis.

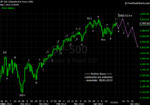
EW fits into my trend following system by filtering the buy signals by wave type. My be$t trades, by far, have been during a third wave (either the general market or the stock itself).

Wave 3 is the first higher low and breaks the previous trend line, and typically follows noticeable divergence in MACD, RSI, money flow, Stochastics, ROC, and any other momentum indicator. A huge candle as the dam breaks is the final confirmation.

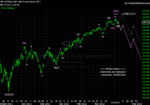
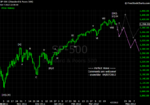
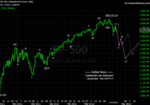
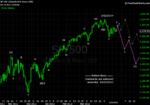
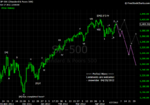
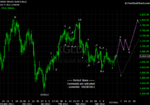
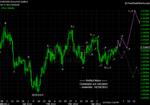
OP: my comment for your analysis is that I'm amazed how far you take the corrective wave counts. I've never had much success trying to analyze them. I see the SP500 currently in a B wave completing the C wave of next lower degree, itself seeing wave 5 of next lower degree completing as I type.....

:D

Wide Tailz - Thanks for commenting. Believe it or not, I don't give a shxt on any fundamental analysis. Ironically, I used to be doing and writting a lot of fundamental analysis, and I knew that it was just like writing some stories because people wanted to read stories.

I strongly agree with you that the best and easist trades are on the wave-3. About the question how I "take the corrective wave counts", I start from the highest possible degree of timeframe (e.g., montly chart) to analyze and then scale down to the tradeable timeframe (e.g., daily chart). Therefore, sometime a corrective wave in a monthly chart still has some impulsive wave in the daily chart which we can make money from. :)
 
03/29/2012

Comments are welcome!
 

Attachments

  • 20120329 SP - Daily.png
    20120329 SP - Daily.png
    51.9 KB · Views: 1,024
03/31/2012

Comments are welcome!
 

Attachments

  • 20120331 SP - Daily.png
    20120331 SP - Daily.png
    48 KB · Views: 950
  • 20120331 JPY - Daily.png
    20120331 JPY - Daily.png
    49.6 KB · Views: 938
  • 20120331 Gold - Daily.png
    20120331 Gold - Daily.png
    43.4 KB · Views: 1,002
  • 20120331 EUR - Daily.png
    20120331 EUR - Daily.png
    42.6 KB · Views: 1,008
04/07/2012

Comments are welcome!
 

Attachments

  • 20120407 EUR - Daily.png
    20120407 EUR - Daily.png
    42 KB · Views: 1,004
  • 20120407 Gold - Daily.png
    20120407 Gold - Daily.png
    46.4 KB · Views: 984
  • 20120407 JPY - Daily.png
    20120407 JPY - Daily.png
    48.7 KB · Views: 961
  • 20120407 SP - Daily.png
    20120407 SP - Daily.png
    47.2 KB · Views: 981
Quote from ScalperJoe:

snowrider,

I am discussing the current waves with trader collegue regarding the S&P, and we have come to the following conclusion that Wave 5 of Wave 3 has completed, and the S&P is currently in Wave 4. I've also read and heard that Wave 4 of the larger pattern already occurred, however our analysis is there has not been any significant pullback to justify a completed Wave 4.

Our wave counts of the larger pattern (weekly chart):

Wave 1 from 1,075 to 1,293

Wave 2 from 1,293 to 1,159

Wave 3 from 1,159 to 1,422

Wave 4 will result in a choppy "A-B-C" pattern, perhaps stalling around 1,320 (38.2% fib of Wave 3), although holding well above the top of Wave 1 at 1,293.

Then a rebound Wave 5 pattern which will break the top of Wave 3 of 1,422, hence completing the 5 wave pattern that began on October.

A larger correction (perhaps 50%) of the completed 5 wave pattern will create the next big buying oppourtunity.

Please provide feedback/comments to this analysis, thanks.


ScalperJoe- Thanks for sharing your thought. That scenario is a good and valid one. Please see attached wave count. Your wave count is labeled there as [A][C][D][E] in green line alternative count. Currently my preferred count is that a wave-[] (which is your wave-3) has ended, and a big collapse all the way to 960 area in the end of this year is underway. I will pay very close attention if SP ever goes to 1320 area to see if it has any sign of bottoming there. The 1320 area will be the cross road between a real collapse or a final leg up.

attachment.php
 
...
One question for you is that you think we are still in the wave 4 from peak of 2000? What formation will this wave 4 take?
...

busted - Thanks for commenting. Yes, I agree with you (kind of) that EW "is very complicated". But I would like to say that it is very easy to use in trading (because EW has some rules for validating a wave). About your question if "we are still in the wave 4 from peak of 2000", that is what my assumption for labelling 667 (2009) as [[[C]]] is based on. With that assumption, the "wave 4" is in the formation of a huge triangle. About QE3, I don't care, and I never care any FA stuff.
 
Quote from ScalperJoe:

Got it, thanks. However, I'm curious as to how you get the 960 target, and what is the scenario for it to occur this year?

If it breaks 1,320 then perhaps it goes flatline to around 1,250-1,290 range during mid-summer (near mid-point of 5 wave pattern which began last October), before closing out in the black for 2012.

Without some climactic event (war, lack of additional QE, hyperinflation, Euro/dollar collapse, etc), I'm not sure the market is poised break the prior two years of intrayear lows and to fall to 960. I'm not suggesting it won't retrace on the larger wave count eventually, just not by the end of this year.

Your thoughts, comments?

ScalperJoe - Thanks for nice commenting. About the 960 area target, it is just at a 0.382 fib ratio from 2009-03 lo to the recent hi. I would like to take back what I mentioned last time about the timing of the end of this year. I mentioned that because I wanted to load something for next year by the end of this year. The actual timing could be 2013-09 to see the big cycle low. When the time is there, and when the price is at a fib ratio (say, 0.5 at 1045), that will be an excellent opportunity to load.
 
Quote from toc:

Snowrider,

given that you have been doing the EW for sometime now, what percentage of your calls prove to be good. have never been into EW although use Fib retracements etc. at times.

toc - The successful rate of my purple lines (preferred counts) is about 50% (half-half), so it is nothing special and nothing significant by simply following my purple lines. However, the good thing and advantage of using EW for trading because it provides some strict rules so that we know where to go and where to stop once our preferred counts are wrong.
 
Quote from ScalperJoe:

snowrider,

Given the recent swings in SPX, is it safe to interpret the past five down bars as "A" and today's snap back rally as "B" of Wave 4, which may last a few more days, followed by a "C" wave back down? The way I read the current pattern, the SPX falls below its current 50 day moving average of 1,370 again, thus completing the A-B-C pattern in Wave 4.

However, I find the difficulty in EW analysis is in attempting to pinpoint the accuracy of when Wave 4 ends and when Wave 5 begins, until of course after the fact!

ScalperJoe - Yes, that is a way of counting this if we predict that the downward movement is in ABC mode. Another way of counting this is to treat the 5 down bars as wave 1 of the downward movement, so we just about finishing wave 2. There are many other ways of counting this. My trading philosophy is trying to lay out as many possible counts as I can, and then watch those critical area to see if there is any reversal sign (in order to confirm which count is more likely and to trade).
 
04/14/2012

Comments are welcome!
 

Attachments

  • 20120414 EUR - Daily.png
    20120414 EUR - Daily.png
    42.6 KB · Views: 1,354
  • 20120414 Gold - Daily.png
    20120414 Gold - Daily.png
    42.8 KB · Views: 1,285
  • 20120414 JPY - Daily.png
    20120414 JPY - Daily.png
    49.2 KB · Views: 1,270
  • 20120414 SP - Daily.png
    20120414 SP - Daily.png
    47.7 KB · Views: 1,300
snowrider,
the count of the "thewavetrading" since the oct. 2011 low for the S&P is more logic for me than yours:

ImageShack® - Online Photo and Video Hosting
Sixer

Sixer - Thanks for sharing your thought! Yes, yours is a valid and good count. I have had similar count before changing to the current one. If we count that way, the wave-IV (your (4) wave) could also be counted as a flat. See the following old post:

133258d1332630014-perfect-wave-2012-1-2-20120324-sp-daily.png


And your count:
 

Attachments

  • ewsp124.png
    ewsp124.png
    226.3 KB · Views: 1,028
04/21/2012

Comments are welcome!
 

Attachments

  • 20120421 EUR - Daily.png
    20120421 EUR - Daily.png
    48.5 KB · Views: 1,219
  • 20120421 Gold - Daily.png
    20120421 Gold - Daily.png
    44.3 KB · Views: 1,194
  • 20120421 JPY - Daily.png
    20120421 JPY - Daily.png
    50.7 KB · Views: 1,194
  • 20120421 SP - Daily.png
    20120421 SP - Daily.png
    44.8 KB · Views: 1,191
Quote from Wide Tailz:

So we all anticipate the SP500 coming down from the bear flag. This consensus makes me nervous... traders rarely agree!


Wide Tailz - Thanks for commenting. I am nervous too because the market won't let people make money so easily. See my purple line wave count has a wave-2 in a bull trap formation. I would like to see a pop before the market starts moving down.
 
04/28/2012

Comments are welcome!
 

Attachments

  • 20120428 SP - Daily.png
    20120428 SP - Daily.png
    46 KB · Views: 1,069
  • 20120428 JPY - Daily.png
    20120428 JPY - Daily.png
    48.8 KB · Views: 1,063
  • 20120428 Gold - Daily.png
    20120428 Gold - Daily.png
    43.8 KB · Views: 1,108
  • 20120428 EUR - Daily.png
    20120428 EUR - Daily.png
    49.6 KB · Views: 1,056
05/01/2012

Comments are welcome!

So ... possiblly an ending diagonal triangle is forming.
 

Attachments

  • 20120501 SP - Daily.png
    20120501 SP - Daily.png
    46.1 KB · Views: 1,199
It's good that SP futures pulls up a lot before the market opens. We will need to watch to see if the cash index would fall below the starting point of last up waves - the low of 04/23/2012 in order to decide which count is valid.

If 04/23/2012's low is breached, the wave count of 04/28/2012's post becomes valid. Otherwise, last weekend's count is valid.
 
Quote from ScalperJoe:

Ok, so if the March low of 1,340 holds then I agree with scenario 1 that the market would rally as a wave [V] for a retest of the highs.

If it doesn't, then one target for scenario 2 downtrend is the next fib level of the bigger 5 wave pattern, which happens to correspond very closely with the Wave 1 top of around 1,293.

Given that the 100day moving average and two large daily tails offer support on the SPX chart, it seems more likely that your scenario 1 will prevail. These corrective wave patterns are quite tricky, and definitely have more headfakes than the clearer Wave 3 pattern.

ScalperJoe - Good point! Yes, the 1340 is the wave-4 (the lower degree wave) where a corrective wave would stop. Thanks for summerizing those two scenarios. Today the market gaps up, we will need to see if the gap can hold or not. If the gap holds and market goes higher, then probably the wave-[V] is underway. If the market fails to move up, we need to be careful that it could be forming a wave-2 (corrective wave) in the scenario #2.

(More posts and charts on my blog.)
 
Top