Dr. Toad's Journey to Bankruptcy or Financial Freedom

Here is an example of Tessla shares traders were loading upon with options.They are now over $300.

At the same Amazon was good buying opportunity around $770.

This is not hindsight , but when you see technical opportunities , leverage with options in trending markets or high probbility swing trades.

Er, it is hindsight, but legitimate since it's the only way of demonstrating the point you were making. Just goes to show that not all hindsight is a bad thing :)
 
Here is an example of Tessla shares traders were loading upon with options.They are now over $300.

At the same Amazon was good buying opportunity around $770.

This is not hindsight , but when you see technical opportunities , leverage with options in trending markets or high probbility swing trades.

Show some of your actual trades, not fantasy ones.

Here is an equivalent of your post. Cor blimey 24,322/1 wow that is the kind of acca I am looking for.

13:55 3 Wrexham Lager Novices' Chase Lofgren 2/1
14:30 7 Wrexham Lager Maiden Hurdle Lieutenant Gruber 1/4 Fav
15:05 10 Wrexham Lager Original Brew Novices' Handicap Hurdle Too Many Diamonds 4/7 Fav
15:40 6 Wrexham Lager Export Handicap Chase The Clock Leary 5/2
16:15 8 Wrexham Lager Export Handicap Hurdle Zenafire 11/4
16:50 7 Buck House Hotel Handicap Chase Cruising Bye 16/1
17:20 9 Goldford Stud Mares' Standard Open NH Flat Race Chilli Filli 18/1
 
3)market timing
A good article in market timing here , forget the hindsight technical anylysis

This is not hindsight , but when you see technical opportunities , leverage with options in trending markets or high probbility swing trades.

I am so confused. You say to not use "technical anylysis" but then say to use "technical opportunities" as signals. How can I determine when "technical opportunities" present themselves if I do not do any "technical anylysis"

Also can you please quantify for me what you consider "high probbility swing trades". This is something I intend to start investigating myself (next on my long to do list). If you could, please tell me how far back you tested your "high probbility" swing trading strategy and how many trades were used in your sample? Also, how many live forward test trades of your strategy do you have so far and is your live testing matching with your development testing?

What I meant is , if you use options , you don't need to tie up all your capital .This I do in my foresight trades .

Three problems with this:

1. Options have a time value. You have to be correct at the correct time, just like any short term trading strategy. This would kill the longer term strategy I am looking at currently. It is more of a "I am never wrong" strategy...in fact if I start using it (unlikely since I am mostly just looking at it out of curiosity), that is what I will call it.

2. Options are only a viable strategy when used on stocks trading very large volumes such as the ones you presented. This cuts the pool of viable trades down by an order of magnitude. Not necessarily a bad thing, but generally more opportunities --> greater diversity --> lower risk. Options in general have much greater spreads and much lower volume. You can't buy something if no one is willing to sell it...

3. I looked into this a long time back and tried to get started with it, but I was not approved for buying options. I have only been approved for selling options through one of my brokers. I suspect I could get this changed now if I really wanted, but this coupled with the extremely low/nonexistent volume for options on stocks I would want to use it on turned me away from them.
 
Dr T

Technical Analysis can be thought of as being about predicting where price may go next (not all that successfully in my view). Technical opportunity, however, is not about predicting, but about price being at a point where you can use TA as a tool to trade - taking appropriate advantage when it goes favourably and limiting the damage when it doesn't.
 
Er, it is hindsight, but legitimate since it's the only way of demonstrating the point you were making. Just goes to show that not all hindsight is a bad thing :)

So how do you include foresight ?

When I knew Amazon would rise , I was not sure ofprice , but my fundametal thinking was "internet based selling would take over ".

I still believe high street banking will be consolidated in U K , IN OTHER WORDS LESS PLAYERS IN EXISTENCE in banking sector.

So beliefs play an important part.
 
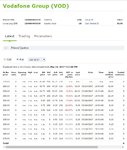
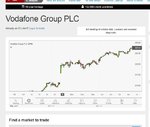
ANYTHING HERE ?Been watching this
 

Attachments

  • VOD.jpg
    VOD.jpg
    97 KB · Views: 152
  • BVBV.jpg
    BVBV.jpg
    59.2 KB · Views: 158
ANYTHING HERE ?Been watching this

Yes I think you are on to something.

Shares go up and put options go down.
I just scanned a load of shares and you are right it is a repeating pattern.
I will check and see if shares fall and call options fall and puts rise at the same time.
Lots of backtesting to do here. Sneaky markets, good for you to out their secrets like that.


I hope you are being sarcastic and I just don’t get it. In that case please ignore what follows.
Fundamentals in option pricing dictate that derivatives will change value in line with the changes in underlying by an amount shown by the derivative’s delta. Calls have +ve and puts have -ve deltas, therefore, what you are describing is caused by moves in the stocks.
There are times when the underlying drops and Calls go up but that’s because of the volatility component (lookup VIX).
 
Yes I think you are on to something.

Shares go up and put options go down.
I just scanned a load of shares and you are right it is a repeating pattern.
I will check and see if shares fall and call options fall and puts rise at the same time.
Lots of backtesting to do here. Sneaky markets, good for you to out their secrets like that.

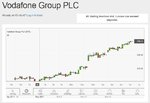
nice way to make money without the full investment.been watching since 220
 

Attachments

  • vod.jpg
    vod.jpg
    43.5 KB · Views: 145
I hope you are being sarcastic and I just don’t get it. In that case please ignore what follows.
Fundamentals in option pricing dictate that derivatives will change value in line with the changes in underlying by an amount shown by the derivative’s delta. Calls have +ve and puts have -ve deltas, therefore, what you are describing is caused by moves in the stocks.
There are times when the underlying drops and Calls go up but that’s because of the volatility component (lookup VIX).

I thought Delta was a dodgy airline where all the trolley dollies were a long way past their sell by dates and with a pi55poor attitude.
 
Trying something a bit different...maybe I am making this more difficult than it needs to be so. Some live calls:

Rules for all:

1. If trade reaches within 25% of target before entry, entry is canceled.
2. If entry does not occur prior to 1:00 ET (3.5 hours into trading day), entry is canceled.
3. Once in trade, sell only at target profit, stop loss, or end of day. Whichever is hit first.

Trades for 5/31/2017

Symbol: AON
Entry: $130.16 (Limit)
Stop Loss: $128.94 (Stop Market)
Target Profit: $131.39 (Limit)
Cancel Trade Level: $131.08
Reward/Risk: 1.01

Symbol: G
Entry: $27.26 (Limit)
Stop Loss: $26.95 (Stop Market)
Target Profit: $27.46 (Limit)
Cancel Trade Level: $27.40
Reward/Risk: 0.66

Symbol: MCD
Entry: $149.93 (Limit)
Stop Loss: $148.87 (Stop Market)
Target Profit: $150.73 (Limit)
Cancel Trade Level: $150.53
Reward/Risk: 0.75

Symbol: GLPI
Entry: $36.84 (Limit)
Stop Loss: $36.55 (Stop Market)
Target Profit: $37.10 (Limit)
Cancel Trade Level: $37.03
Reward/Risk: 0.91

Symbol: NEE (someone more intelligent than me might conclude this one is stupid since it appears to have hit a top on 5/26/17)
Entry: $140.65 (Limit)
Stop Loss: $139.56 (Stop Market)
Target Profit: $141.35 (Limit)
Cancel Trade Level: $141.18
Reward/Risk: 0.64

Symbol: PM
Entry: $119.46 (Limit)
Stop Loss: $118.04 (Stop Market)
Target Profit: $120.59 (Limit)
Cancel Trade Level: $120.31
Reward/Risk: 0.81

Symbol: YUM (someone more intelligent than me might conclude yet again that this one is stupid since it appears to have hit a top on 5/26/17 as well)
Entry: $72.31 (Limit)
Stop Loss: $71.45 (Stop Market)
Target Profit: $72.75 (Limit)
Cancel Trade Level: $72.64
Reward/Risk: 0.51


Only paper trading now since I mostly expect this to fail miserably and I am pretty sure I tried a variant of this before just don't remember why I stopped looking at it if I did...trading can't possibly be this simple.

Not quite as specific as the stuff that foroom lluzers has been posting recently in this thread, but hopefully specific enough to satisfy the peanut gallery nonetheless.
 
Using a trade management of equal risk each trade (say 1% risk each):

Results from 5/31/2017

Symbol: AON
Cancel trade level reached at open before entry reached --> no trade taken

Symbol: G
Cancel trade level reached near open before entry reached --> no trade taken

Symbol: MCD
Trade entry at ~9:35 ET as MCD traded through entry level of $149.93. Target profit reached at ~ 2:20 ET as MCD traded through target profit level of $150.73.

Reward/Risk was 0.75, so +0.75%

Symbol: GLPI
Trade entry on open as GLPI opened $0.02 below entry level of $36.84. Neither target profit or stop loss hit.

End of day sell at $36.70 (49% of the way to stop loss), so -0.49%

Symbol: NEE
Cancel trade level reached near open before entry reached --> no trade taken

Symbol: PM
Cancel trade level reached at open --> no trade taken

Symbol: YUM
Cancel trade level reached near open before entry reached --> no trade taken


Day net: +0.26%


I think I remember why I stopped messing with this one...too many missed trades...anyways:

Trades for 6/1/2017

Symbol: AON
Entry: $130.71 (Limit)
Stop Loss: $129.45 (Stop Market)
Target Profit: $132.10 (Limit)
Cancel Trade Level: $131.75
Reward/Risk: 1.11

Symbol: G
Entry: $127.31 (Limit)
Stop Loss: $27.00 (Stop Market)
Target Profit: $27.58 (Limit)
Cancel Trade Level: $27.51
Reward/Risk: 0.85

Symbol: MCD
Entry: $150.09 (Limit)
Stop Loss: $148.95 (Stop Market)
Target Profit: $151.57 (Limit)
Cancel Trade Level: $151.20
Reward/Risk: 1.30

Symbol: NEE
Entry: $141.14 (Limit)
Stop Loss: $140.04 (Stop Market)
Target Profit: $142.18 (Limit)
Cancel Trade Level: $141.92
Reward/Risk: 0.94

Symbol: PM
Entry: $119.80 (Limit)
Stop Loss: $118.82 (Stop Market)
Target Profit: $121.57 (Limit)
Cancel Trade Level: $121.13
Reward/Risk: 1.81

Symbol: MJN
Entry: $89.35 (Limit)
Stop Loss: $89.25 (Stop Market)
Target Profit: $89.48 (Limit)
Cancel Trade Level: $89.45
Reward/Risk: 1.32

Symbol: XEL
Entry: $47.68 (Limit)
Stop Loss: $47.29 (Stop Market)
Target Profit: $48.14 (Limit)
Cancel Trade Level: $48.03
Reward/Risk: 1.21
 
Using a trade management of equal risk each trade (say 1% risk each):

Results from 6/1/2017

Symbol: AON
Entry never reached --> no trade taken

Symbol: G
Entry never reached --> no trade taken

Symbol: MCD
Entry never reached --> no trade taken

Symbol: NEE
Entry level of $141.14 reached near open, end of day sell @ $141.87 (70% of the way to the target profit), so with a reward/risk of 0.94, net is +0.69%.

Symbol: PM
Entry level of $119.80 reached near open, end of day sell at $120.91 (63% of the way to the target profit), so with a reward/risk of 1.81, net is +1.14%.

Symbol: MJN
Entry never reached --> no trade taken

Symbol: XEL
Entry level of $47.68 reached around 10:40 ET (and again around 12:45 ET), end of day sell at $48.11 (93% of the way to the target profit), so with a reward/risk of 1.21, net is +1.13%.

How is that one for a live advance call? Low of the day was $47.67 ($0.01 below my called entry) and high of the day was $48.13 (again $0.01 below my called target). I guess even a broken clock is right twice a day, huh?

Day net: +2.96%


I should probably stop while I am ahead...will post calls for tomorrow later (and if I were a betting man, I would bet against them), off to celebrate my fictitious good day with some fictitious beer. What's the over/under on my calls for tomorrow?
 
Trades for 6/2/2017

Symbol: AON
Entry: $131.45 (Limit)
Stop Loss: $130.15 (Stop Market)
Target Profit: $132.14 (Limit)
Cancel Trade Level: $131.97
Reward/Risk: 0.52

Symbol: G
Entry: $27.52 (Limit)
Stop Loss: $27.19 (Stop Market)
Target Profit: $27.86 (Limit)
Cancel Trade Level: $27.77
Reward/Risk: 1.03

Symbol: NEE
Entry: $141.14 (Limit)
Stop Loss: $140.04 (Stop Market)
Target Profit: $142.24 (Limit)
Cancel Trade Level: $141.97
Reward/Risk: 1.01

Symbol: MCD
Entry: $150.84 (Limit)
Stop Loss: $149.70 (Stop Market)
Target Profit: $152.83 (Limit)
Cancel Trade Level: $152.33
Reward/Risk: 1.74

Symbol: XEL
Entry: $47.83 (Limit)
Stop Loss: $47.44 (Stop Market)
Target Profit: $48.27 (Limit)
Cancel Trade Level: $48.16
Reward/Risk: 1.11

Symbol: PM
Entry: $119.79 (Limit)
Stop Loss: $118.33 (Stop Market)
Target Profit: $121.38 (Limit)
Cancel Trade Level: $120.99
Reward/Risk: 1.09

Symbol: APTI
Entry: $16.68 (Limit)
Stop Loss: $15.95 (Stop Market)
Target Profit: $17.36 (Limit)
Cancel Trade Level: $17.19
Reward/Risk: 0.95

Happy money making? Maybe I should actually backtest this tomorrow and implement it next week...
 
Using a trade management of equal risk each trade (say 1% risk each):

Results from 6/2/2017

Symbol: AON
Entry level of $131.45 reached near open, end of day sell at $131.31 (11% of the way to the stop loss), so trade net of -0.11%.

Symbol: G
Cancel trade level reached at open --> no trade taken

Symbol: NEE
Cancel trade level reached at open --> no trade taken

Symbol: MCD
Cancel trade level reached at open --> no trade taken

Symbol: XEL
Cancel trade level reached at open --> no trade taken

Symbol: PM
Cancel trade level reached at open --> no trade taken

Symbol: APTI
Cancel trade level reached at open --> no trade taken

Day net: -0.11%

Essentially nothing happening today since pretty much everything gapped up some amount.
 
Top