Dr. Toad's Journey to Bankruptcy or Financial Freedom

I am keeping my update short this month as I have already gone over most of the items in detail. The main problem with this month was testing out to many things at once as pointed out by rathcoole_exile. Although this is the case, I do believe I would have ended the month profitable had the market not entered a death spiral. My profit/loss curve is shown below which highlights this.


The loss on all of these trades I had going comes to around $750, but really the loss was more since all of the trades were in profit at the time. Any loss sucks, but I am pretty sure I fared better than a good number of people who had mostly long position open. All of this is really just making me like the day trade strategy better. Being down $1,000 does suck a bit, but keeping things in perspective this is about what I have saved in lifestyle changes from when I started, so I'm not losing sleep over it.

The losing is getting a bit discouraging, and if I have another month of losing I may be re-evaluating my foray into trading and determine if it is really worth my time. Although I do find the market fascinating, if you suck at something, you certainly can't do it for a living. I do believe I am able to "see" where the market is going better now than when I started which will help my day trade strategy. This is the only thing I will be using going forward...at least for the time being especially since I see the market continuing on down in the near future.

I do not believe the market going down or up makes much difference to my day trade strategy, the main thing that will be the death of it is high volatility. For that reason I opted to stay out of the action Monday through Thursday this week. So, I only have one more trade to add to my Probability strategy stats which now stand at:

# wins = 5, average win % = 0.728%
# losses = 3, average loss % = 0.537%
Probability of 3 or fewer losses in 8 trades based on metric stats = 42.78%

Still to early to conclude much of anything other than it has made me more money than lost me to this point.
 
So I tried a more normal daytrade today in my frustration with the system that I am trying out. It is starting to look like it is not much better than throwing a dart blindfolded...still to early to conclusively say that though. It is slow at the office now so I could do a bit of babysitting my trade...you can witness my awesomeness below.


So, I am 2 for 2 (+0.15 and +0.14). If only I had the foresight to trade 10 million shares on one of those, then I would have made an easy 1.5 million or 1.4 million, no sweat. Forget that I would have needed 2.25 billion dollars to execute it and needed to trade 10% of the stocks shares...those factors are irrelevant.

On a bit more serious note though, it does seem that trends always break down right when I enter them (talking about the 2nd entry here as the 1st was not exactly trend based). I should not have raised my entry for the second trade, but I still feel that around 225.10 would have been a justified entry...still...dropped like a rock right after my entry both times, and just about dropped to the point I would have taken my loss at both times. Then to top it off, a nice up trend starts shortly after I exit...both times. Nothing points out how much you suck more than entering right before a drop and exiting right before an upswing. Oh well...managed to get out with no harm both times...still very frustrating though.
 
I do believe I am able to "see" where the market is going better now than when I started which will help my day trade strategy.

sounds dangerous.

Do you know @darktone? He knows nothing and seems to do ok.
 

Attachments

  • IMG_20141102_082340.jpg
    IMG_20141102_082340.jpg
    15.8 KB · Views: 218
sounds dangerous.

Do you know @darktone? He knows nothing and seems to do ok.

Like the chart. Good to know I have progressed to the "I'm an expert" phase. I don't feel like I have made much progress, but perhaps lurking in the hind site trading thread has improved my skills more than I thought.
 
Summary of Probability Trade (version 1.0)

I am ending my testing of this early for two reasons:
  1. It does not work as well as I want. I have had 5 consecutive losses and 7 of the last 8 trades made under this system were losses. Statistically this is incredibly unlikely to happen with a system that has an expected positive outcome greater than 50% (less than 5% chance of occurrence with coin toss probability and essentially 0% chance with expected win rate of ~70%).
  2. It is more difficult and time consuming than expected to execute this as there is some required "screen watching" to get a good entry and if the trade is going against me so I can get a better exit than my prescribed stop.

I have been documenting all of the trades made under the system and will outline them below for my own sake (including ones previously posted).

Probability Trade 1
Date: 8/13/15
Stock: PGR
sell 150 shares @ 31.00 - buy 150 shares @ 30.78 = +$33.00 (+0.71%)


Probability Trade 2
Date: 8/14/15
Stock: PCL
sell 175 shares @ 41.44 - buy 175 shares @ 41.19 = +$43.75 (+0.61%)


Probability Trade 3
Date: 8/17/15
Stock: CLX
sell 85 shares @ 117.77 - buy 85 shares @ 116.55 = +$103.70 (+1.05%)


Probability Trade 4
Date: 8/18/15
Stock: AMT
sell 125 shares @ 100.56 - buy 125 shares @ 100.81 = -$31.25 (-0.25%)


Probability Trade 5
Date: 8/19/15
Stock: JPM
sell 225 shares @ 68.05 - buy 225 shares @ 67.63 = +$80.60 (+0.53%) [$6.95 commission on sell]


Probability Trade 6
Date: 8/20/15
Stock: CMA
sell 400 shares @ 45.66 - buy 400 shares @ 45.93 = -$128.85 (-0.70%) [$6.95 commission on buy and sell]


Probability Trade 7
Date: 8/21/15
Stock: PDM
sell 1100 shares @ 17.94 - buy 1100 shares @ 18.04 = -$160.35 (-0.85%) [$6.95 commission on buy and sell]


Probability Trade 8
Date: 8/28/15
Stock: JPM
sell 300 shares @ 64.39 - buy 300 shares @ 63.85 = +$141.15 (+0.74%) [$6.95 commission on buy and sell]


Probability Trade 9
Date: 8/31/15
Stock: DEI
sell 800 shares @ 27.87 - buy 800 shares @ 28.15 = -$244.85 (-1.09%) [$6.95 commission on buy and sell]


Probability Trade 10
Date: 9/01/15
Stock: MD
sell 275 shares @ 78.65 - buy 275 shares @ 78.80 = -$41.25 (-0.19%)


Probability Trade 11
Date: 9/02/15
Stock: DDR
sell 1400 shares @ 15.12 - buy 1400 shares @ 15.16 = -$56.00 (-0.26%)


Probability Trade 12
Date: 9/03/15
Stock: MAC
sell 300 shares @ 75.16 - buy 300 shares @ 75.57 = -$123.00 (-0.54%)


Probability Trade 13
Date: 9/04/15
Stock: ABBV
sell 350 shares @ 59.95 - buy 350 shares @ 60.11 = -$56.00 (-0.27%)


One observation I made on this last one since I was able to watch the Level 2 quotes (had a day off work) is as follows:

There was a very large order set at $60.00 right from the open. The order was an order of magnitude larger than any other price points. This was why I set my buy order close but above at $60.11 and my stop just below this point at $59.95. I thought the price would proceed one of two ways around this point.

  1. The $60.00 would act as a support point and the price would not proceed much further down than this if it was reached at all.
  2. The $60.00 order was set to keep the price high as long as possible while the same person sold off as many shares as they could above this. The thought being this order would be pulled when it was close.

If you look at the price action, you can see the price was repelled away from the $60.00 for a while. As it turned out the order was filled and the price continued down. Not what I was expecting since the order was not pulled, but the other times I have looked at level 2 quotes, the price always seems to eventually migrate towards the high order of magnitude orders rather than away from. Very counter-intuitive, but the next time I get an opportunity to trade with level 2 quotes I will play them by going towards the high order of magnitude orders rather than away from. The basic assumption with this is the order is set mainly for someone to try to unload or buy as many shares as possible prior to the point being reached.

The failure of this system is likely due to a combination of factors including but not limited to:
  • The beginning of the day flux making the theoretical probabilities of several of the stocks artificially higher.
  • The look back period being used to find the stock being too large for a short term strategy. The look back period was 100 days.
  • A general change in market sentiment following the drops in the market on August 24th.

The overall summary of the strategy testing is as follows:
  • Net loss of $409.85. Had I kept all trades the same size rather than ramping up, this would have been minimal...won't do that again until strategy is confirmed to be plausible with at least 1 month of test data.
  • 5 wins, 8 losses
  • average win 0.73%, average loss -0.49%

For the most part, I am pleased with my ability to exit the losing trades before they got that far away from me. I believe I only let the price proceed all the way to my set stop once, and I almost always got out at a better point than had I stayed in the trade longer.

I have already taken the failures of this system and used them in combination with the line strategy to develop the Probability Trade (version 2.0) to be posted later. I will be testing this one live with more limited capital (probably 1/4 of what I was using at the end of this set of testing) so I can prevent slowly bleeding my account away while I find something that works. If this one doesn't work than I do not think a day trade strategy will be possible for me until I can actually dedicate time to watching the trades. Here's to hoping I have an idea that will work this time.
 
Summary of Probability Trade (version 1.0)

I am ending my testing of this early for two reasons:
[

The failure of this system is likely due to a combination of factors including but not limited to:
  • The beginning of the day flux making the theoretical probabilities of several of the stocks artificially higher.
  • The look back period being used to find the stock being too large for a short term strategy. The look back period was 100 days.
  • A general change in market sentiment following the drops in the market on August 24th.


Good to see some cold self-critical review of performance. Its crazy to ignore our mistakes and keep running systems we've invested a lot of time in developing - but its very tempting and dangerous for that reason.

I'm hoping to see you do some new testing with a new or at least modified system. I hope you do see this test as successful - the object was to prove if the trading system worked - although the system didn't, now you know why

I 'd like to help with some suggestions, sorry if I'm just repeating obvious rules -

1 - simplest is best:
a) easier to follow rules in real time
b) more accurate backtesting is possible
c) the basis of the system should be in line with actual price tendencies

2 - test with variance on one parameter at a time, then you can quantify its effect in isolation

3 - all parameters have to be visible in backtesting time as well as in real time: you have to be able to determine what you would have done as well as what you will do

4 - all stocks tend to move together when strong forces hit the market: a varied range of forex pairs would be less correlated with each other.

Good luck.
 
Hi Dr. Toad,
I concur with Tom's comments about reviewing what you've done and calling time on something that's not working. I'm in half a mind about whether or no to comment any further as I've only lightly skimmed over your thread, so what follows could well be wrong, inappropriate or both! Apologies in advance if this is the case. Anyway, here goes. . .

My impression (which could be completely wrong) is that you're trading U.S. equities in isolation without putting them in the context of their sector and the market as a whole? I no longer trade this market, but I have in the past for many years. Whilst I can't claim to have been especially good at it, I am absolutely 100% certain that had I not paid attention to the sector and main equity indices - the results would have been utterly disastrous. 'A rising tide floats all boats' is an expression you'd do well to keep in mind IMO, and may have saved you some pain - aka losses - when the market tanked last month. Very, very few stocks can withstand the ebb and flow of the market as a whole. So, going forward, whatever your micro criteria is for stock selection, entry and exit, I urge you to start with a macro view of sector and the market as a whole first - and be guided by what's going on there.

There are various ways of doing the above. The simplest is to look at charts of the cash index, along with market breadth indicators such as these if swing trading, and futures charts if day trading. Always take your cue from them and never trade against them.
Tim.
 
Thanks for your input tomorton and timsk. Any input is very helpful to me, if it is along my lines of thinking it makes me a bit more confident, and if it is contrary to my thinking it forces me to justify my reasoning to myself and reconfigure if I can't.

1 - simplest is best:
a) easier to follow rules in real time
b) more accurate backtesting is possible
c) the basis of the system should be in line with actual price tendencies

Completely agree with this. I have a tendency to over-complicate things. The probability trade 1.0 was more time consuming to trade in real time since it required checking a basket of stocks and monitoring them until I got what I felt was a good entry point. I have addressed this with the revised version. Once it was entered, it was fairly easy to manage since the rules were clear but I still spent a lot of time screen watching since I didn't have confidence in it (rightfully so) and I ramped up my risk on it to fast. Not a good combo and one I won't repeat.

Another flaw with the 1.0 system was it was not based on the underlying in the moment trend of the stock. I have addressed this with the revised version.

Due to the nature of how these systems have been derived, I do not feel backtesting them is vital. However, as I think you are indicating, it is vital that they should be able to be backtested fairly easily. If something is extraordinarily difficult to backtest accurately (which the 1.0 system would have been), I can't expect it to be traded reliably. During my testing of the 1.0 system, nearly every day about 7 of the 10 stocks I was watching for the day were knocked out on open by hitting either the target sell or both target entry and target sell points within a few minutes...that really should have been a big red flag from the start and that is why the 1.0 would have been exceptionally time consuming to backtest.

2 - test with variance on one parameter at a time, then you can quantify its effect in isolation

There are tweaks I can make to the 2.0 system if it proves successful to extract more from each trade, but I think I will resist the temptation. It is likely I was overfitting each stocks buy and sell points in the 1.0 system. I do not think this caused it to fail, but it would have likely been an issue had it proven semi-successful.

There is only one item I may play with some if the 2.0 system is not working to my satisfaction. This is the ranking criteria. I will keep this in mind if I get to that point, but I do not expect I will modify it much since I am only using the ranking to get the best possibilities and then am using the line technique and a bit of discretion to make the final decision.

4 - all stocks tend to move together when strong forces hit the market: a varied range of forex pairs would be less correlated with each other.

I was noticing that stocks tend to follow the overall market the more I tested the system. Since I believe the direction of the market as a whole is down, it seems silly to be favoring making long trades. It goes against what I am seeing and what I am thinking.

My impression (which could be completely wrong) is that you're trading U.S. equities in isolation without putting them in the context of their sector and the market as a whole? ... So, going forward, whatever your micro criteria is for stock selection, entry and exit, I urge you to start with a macro view of sector and the market as a whole first - and be guided by what's going on there.

You are absolutely correct in your assessment timsk. I have not been looking at the sectors to see the overall trends first. I believe you are right in that this is vital to do and to use as a basis for the direction of the trade. I have implemented this in my 2.0 system as a final validation for my trade selections. Thank you for the link to the thread with the market breadth indicators.

The simplest is to look at charts of the cash index, along with market breadth indicators such as these if swing trading, and futures charts if day trading. Always take your cue from them and never trade against them.

I think I understand what you are getting at with this but I don't think I understand it completely. At the end of this post I explain my first selection in the 2.0 system which uses general industry indicators. My main confusion is why shouldn't I use market breadth indicators for all the trades made? I thought futures were more for commodities...used by companies with large exposure to specific commodities to hedge the risk of large price fluctuation in the future (and apparently used to hedge the risk of snowfall which I find very comical).


The trade I have narrowed down for Tuesday and possibly the entire week is ARMH (semiconductor). Are you suggesting I take a look at silicon futures before making a daytrade with ARMH since this is a main commodity they use (I'm not sure that even exists...)? Why wouldn't I just look at the general trend of semiconductors instead?


Probability Trade (version 2.0)

The revamped probability system is summarized as follows (note this is a short sell system but I can flip it to be a long system as well):

  • Find stocks that are in a downtrend by looking at how many days they have had open to close decreases. I am looking at a 60 day time period, a 15 day time period, and a 5 day time period. The stocks are ranked with the most emphasis given to the 15 day time period using the basic formula: rank = 2.0 * (15 day period down days / 15) + 1.0 * (60 day period down days / 60) + 0.5 * (5 day period down days / 5). The basic screening criteria is the stock must be priced over $20, and the stock must have an average daily volume exceeding 250,000 shares over the past 50 days.
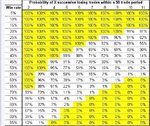
  • Look at the top ranked stocks and determine which stocks over the past 15 days exhibit a risk:reward trade as close to 1:1 as possible. This is done by looking at the percent of the time the stocks decrease 1%, 1.5%, 2%, 2.5% and 3% as well as increase those amounts from their open during the day. The target sell is set at the ~50% decrease mark and the stop loss is set at an increase mark only reached a minimal amount (ideally only once over the past 15 days).
  • Look at the overall trend of the final stock selections as well as the trend of the sectors they are in. Final selection is based on the stock with the clearest trend that is in adherence to sector trend.
  • Once the stock is selected, the trade execution is simple. Short sell at or near the open at or near the open price for the day. Set a limit order for the target buy to cover price and set an alert for when the stop loss price is being approached. If the alert is triggered, buy to cover at the stop loss. If the target buy is not reached, buy at the end of the day (limit order between bid and ask 10 minutes prior to market close, buy at ask if still not bought 5 minutes prior to market close).

To illustrate this fully, I arrived at my selection for Tuesday and likely the entire next week as follows:

After running my screener, the following were the top 8 picks based on the rank.


I eliminated the top pick for a discretionary as well as a strategic reason. Discretionary reason being - although I do not think the oil sector is going to be going up in the short term, I also do not think it will go down much further. I expect it will remain highly volatile in the near future with people trying to guess the bottom. Strategic reason being - target sell would be 2.5% decrease but target stop loss would be in excess of 3%. A 3.5%:2.5% risk:reward is 1:0.714 which is ok, but there are better.

The second pick looks much more promising with a target sell of 1.5% and a stop loss of 1.5% (risk:reward of 1:1).

The third pick looks good based purely on the stats, but since this is a fairly recent addition, it is still trying to find it's baseline which is why there are wild fluctuations. It does seem to have found the baseline where the IPO was set at and I expect this one to disappear from my list in a few days.

The fourth, fifth, and sixth picks look ok, but not a good as the second. I will be keeping a close eye on CBS though since this one has a very clear down trend developed and appears to be consolidating right now before continuing.

The seventh pick does not have a good R:R, and the eight does not have a very well defined trend.


So, since ARMH is my favored pick, I took a closer look at the trend it is in as well as the trend the semiconductor industry is in.


To me, ARMH looks to have a very clear down trend dropping a bit and the consolidating to around the main trend line before dropping down again. It appears to have reached close to the end of it's current consolidation period, so I am expecting it to start dropping again on Tuesday or Wednesday next week. If the price breaks through the main trend (or a better stock presents itself) I will stop trading this stock.

This stock is following the semiconductor trend (clearest when looking at the weekly chart) closely with a drop beginning in June. There appears to be a major support point around the 545 mark and a possible area of support around the 600 level (just above current location).
 
Last edited:
Hi Dr. Toad,
. . . My main confusion is why shouldn't I use market breadth indicators for all the trades made?
No problem doing that at all! The only point about using sentiment or market breadth indicators for swing and position trading is that that some of them are really only applicable to daily timeframes - so you couldn't use them intra day. I may be wrong but, from memory (it's been a while!), Bullish Percent Index falls into this category.

. . . . I thought futures were more for commodities...used by companies with large exposure to specific commodities to hedge the risk of large price fluctuation in the future (and apparently used to hedge the risk of snowfall which I find very comical).?
In terms of their prime purpose, that's my understanding too. However, futures have fringe benefits for intra day traders, as futures can give a heads up about what's likely to happen next because they tend (but not always) to lead the cash index. Also, traders who pay close attention to order flow pretty much have to look at futures as the cash index isn't tradable and, therefore, doesn't offer such insights. In days gone by, when I traded the YM (e-mini Dow), I got very excited about cumulative delta. I only mention it by way of example: it's of little or no use to you swing trading individual equities. That, along with the NYSE $TICK. If you're interested in the relationship between futures and cash - then this thread is worth a look: Index futures correlation to underlying stocks.

. . . . The trade I have narrowed down for Tuesday and possibly the entire week is ARMH (semiconductor). Are you suggesting I take a look at silicon futures before making a daytrade with ARMH since this is a main commodity they use (I'm not sure that even exists...)? Why wouldn't I just look at the general trend of semiconductors instead?
No, not at all: doing as you suggest is ideal. I used to keep it very simple and really only ever bothered checking the Sector SPDR ETFs. (Excellent site as it shows you all the constituent stocks.) The key thing I looked for is how well (or not) the individual equity is correlated to the sector and, in turn, how well the sector is correlated to the equity index - Naz 100 with technology stocks. A stock that holds up well against a falling sector within a falling market makes for an excellent long candidate when both the sector and market themselves turn bullish. Visa versa too of course.

Hope all that makes sense! I should make it clear that it's years since I traded equities - so I'm pretty rusty on all this stuff and not the best person to get advice from. So, take anything I say with a bucket load of salt!
;)
Tim.
 
A stock that holds up well against a falling sector within a falling market makes for an excellent long candidate when both the sector and market themselves turn bullish. Visa versa too of course.

I hadn't really thought about that, but I will definitely keep an eye out for this going forward. Also, thank you very much for all of the links, I will be doing some reading over the next couple of weeks for sure.

Money Management Revised & When to Stop 2.0 Testing

In order to prevent myself from slowly bleeding my account dry while testing this strategy I am revising my money management a bit. Yes I know I could paper trade them, but I simply do not think I would trade them the same way if I were doing that.

I will initially size my positions so that losses that are stopped out hit my account for $25. I will ramp up the risk to $50 after 1 week with more wins than losses. I will keep increasing risk following the same guidelines increasing to $100, then $150, then $200 and so on until I reach my max account risk which I will determine if this goes that far (will be 1% or less for sure though). This will prevent what happened with the 1.0 testing from happening with this one.

For the 1.0 I was increasing the risk by ~$25 each trade until I reached a point where I was losing more than winning and starting to doubt the system. By increasing only after a successful week, I will only be reaching a size that can impact my account substantially after the strategy has given me enough proof to be confident in it.

I am (perhaps foolishly) searching for what I consider to be the holy grail through all this testing. For me this is quite simply a strategy with a win percent close to or exceeding 65% (ideally around 70%) with a risk:reward close to 1:1. The reason I am searching for a high win percent strategy is because I like to know quickly when something is going wrong. With a low win percentage strategy, it would be difficult to tell if something was wrong with the strategy. I believe this is achievable, but maybe I am a fool for thinking so and searching for it.

So...I will consider tweaking the strategy if it becomes obvious to me the strategy has a win rate less than 50%. I intend to give the 2.0 strategy at least 2 weeks before pulling the plug on it...of course if the first 5 trades are losses, I will probably pull it after only a week.
 
So...I will consider tweaking the strategy if it becomes obvious to me the strategy has a win rate less than 50%. I intend to give the 2.0 strategy at least 2 weeks before pulling the plug on it...of course if the first 5 trades are losses, I will probably pull it after only a week.

having 5 losses in a row for strategies in 50-70% win rate rate is not unusual..

Have you backtested the strategy? Backtesting can give you the confidence to get through the losing streaks.
 

Attachments

  • B61xYjyCEAA-ldL.jpg
    B61xYjyCEAA-ldL.jpg
    98 KB · Views: 215
having 5 losses in a row for strategies in 50-70% win rate rate is not unusual.
Hi paszkman,
That's an interesting table you posted - just wondered what your source is?
Thanks,
Tim.
 
The internets.
First place I saw it was this guy:
https://twitter.com/SJosephBurns

If anyone can prove/disprove/explain the table then I am all ears.

I believe you will find this article interesting:
https://courses.cit.cornell.edu/info2950_2012sp/mh.pdf

It goes through a conceptual derivation of how to determine the average number of occurrences needed before the first occurrence of a specific sequence. The basic formula to determine this from the article (equation d2) is as follows:

An = (1 - p^n) / [p^n * (1-p)]

So for instance, in my case I am shooting for a success probability of 65%. If I am interested in finding on average how many trades I would need to make before I had 5 consecutive losses in a row:

A5 = (1 - 0.35^5) / [0.35^5 * (1-0.35)] = 291.

So, I can expect to have 5 consecutive losses in a row about once every 291 trades with such a system. This means my original thinking of this was wrong since my original thinking was this could be derived simply as 1 / 0.35^5 = 190.

The article also indicates there is no good closed form solution for determining the probability of x consecutive occurrences in y trials. It used numerical simulation to determine this for a 50/50 probability situation with 100 trials. The simulation indicates that in this situation, the probability of 5 consecutive occurrences is 81%. For 50 trials I would expect this to be a good amount lower. Your tables indicates this as being 77%...my thinking is this is on the high side although I have not gone through this exercise to conclusively debunk it...yet.

One thing I will say though to justify scrapping the strategy if I have 5 consecutive losses off the bat, is the probability of this occurring is 0.5^5 = 3.1% for a 50/50 system. It would be only marginally higher for a sample size of 10. Yes, still possible, but highly unlikely with a 50/50 system and even less so with something higher than 50/50 probability. Since I am only risking $25 per trade though I may just let it go 6 consecutive losses before scrapping it :p .

I will probably at some point dust of my (quite substantially) lacking matlab programming skills and derive a table similar to this. This is an interesting way of looking at a system, especially in the midst of a loosing streak to help from getting discouraged (or to tell you something is off). I will use this going forward, but I think looking at it from a binomial distribution standpoint is perhaps a bit more useful than this.

See post #12 (page 2) in this thread if you are interested in knowing about that if you don't already. Skip down to the first table I have in that post and then start reading the paragraph before the list of 2 items. You can stop reading the paragraph after the second table. You may find that interesting if you have not already read it. I will give the disclaimer though that my knowledge of probability and statistics is quite limited and it has been a while since I used it, but I do believe what I have posted is correct (dusted off my trusty copy of Kreyszig when I was going through that).


As a final note:
With regards to backtesting. No I have not backtested this one formally yet. I have done a look back with my screener (as far back as 6 months ago) and the majority of the time the stocks that show up in the top 10 continue down for at least some time. Since this system is not purely mechanical I would need to do a monte carlo simulation to properly backtest it...probably allowing it to pick randomly from the top 10. I do not have the software needed to do this. There might be a way to do this in Matlab feeding in data from yahoo finance, but really I am not smart enough to figure that one out. My programming skills are seriously lacking.
 
First trade in 2.0 system:


A loss (seems to be the norm) - This one came close to dropping 1% before heading back north. I may consider revising my targets so I have a very high percentage chance of hitting the target gain (in excess of 80% instead of the 50% I am going for). I considered doing this at the outset but figured I have two things going for me with this. One being I am going in on ones that have a probability of a down day greater than 65%. Two being I am going in on ones with a R:R close to 1:1 with the probability of the worst case scenario being hit less than about 10% of the time and the probability of the target being hit about 50% of the time.

I will leave the system as is for now, but may consider this even if how I have it proves to be successful. In order to help me determine what is best, I will be tracking what could have been if I went with the second option (very high probability of target hit but reward lower than risk).

So, trade 1 summary:
Date: 9/8/15
Stock: ARMH
Outcome: -0.23% (no commission)
"could have been" outcome: -0.23% (no commission)

Tomorrow is the same play for me. One more up day on this one though and it will have broken through the down trend so I will be trading a different play Thursday. If it is a down day tomorrow, I will likely have the same play Thursday.
 
A bad batch of trades has the same effect on account as a series of consecutive losses , ie one step forward 2 steps backwards or 8 losses with 2 winnings in between . The calculation above is for consecutive losses but it doesn't give you the odds for a bad batch .
 
A bad batch of trades has the same effect on account as a series of consecutive losses , ie one step forward 2 steps backwards or 8 losses with 2 winnings in between . The calculation above is for consecutive losses but it doesn't give you the odds for a bad batch .

Which is exactly why I feel looking at it from a binomial distribution standpoint is more useful. You might also find post 12 interesting if you don't already know how to do this.
 
Which is exactly why I feel looking at it from a binomial distribution standpoint is more useful. You might also find post 12 interesting if you don't already know how to do this.

Its all hypothetical , if my win rate now is 60% it doesn't mean it will stay like that , past results are not necessarily indicative of future results.


GL
 
Its all hypothetical , if my win rate now is 60% it doesn't mean it will stay like that , past results are not necessarily indicative of future results.

Right, but if you don't have an idea of your expected wins and losses for a certain period of time, how will you know when something is going wrong? Also, I feel that a good system will not fluctuate much during different market cycles. In the case of this one, it can be done long or short. Even in a ranging market I would imagine there are sectors that are in up trends as well as down trends which is what this strategy seeks out. But then again...maybe I am just dreaming, heck, I don't even have one thing that works decent yet.


A bittersweet victory today for my system. Bittersweet because I was unable to make the play (was on a job site in the morning at market open). I am still considering it as a trade in the system.


Trade 2 summary:
Date: 9/9/15
Stock: ARMH
Outcome: +1.50%
"could have been" outcome: +1.00%

I am switching it up for tomorrow since a better opportunity has presented itself. ARMH still looks like a good play and is right at the trend line. My play for tomorrow is:


Stock is TCO, target is 1% decrease, stop loss is 1% increase. Both the stock and sector are currently in a downtrend. I will be setting a market order for the open from now on with this one. This strategy lends itself nicely to that, and by doing this, there is less chance I will "screw it up" by trying to get a better entry. It will also allow me to enter if I am otherwise unable to right at the market open.

Anyone have thoughts on market orders at open? I have avoided them to this point since I always think I will get screwed over doing it, but now I am thinking most of the time I will get filled close to the open price. I would imagine I will get better fills as often as I get worse fills doing this. Anyone with experience care to comment?
Hi Dr. Toad,
I've not swing traded a great deal and I'm certainly not any good at it, largely because - whenever I've tried - I've struggled to make the kinds of decisions you're making here because you're not able to screen watch. However, for what it's worth, if I was going down the route you propose, I'd make sure that the volatility of the stock and my stop loss (SL) and profit targets are aligned.

TCO is trending down and you're short (or will be at market open) so, in theory at least, probability is on your side and your profit target will be hit before the SL. However, if you look at the volatility of TCO (adding the standard 14 period ATR is as good a way as any that I know of), then you'll see that the stock could easily move almost $1.50 on the day. Current price is around $67.00 and, with a target of 1%, you're aiming for $0.67 per share traded. One thing's for sure, with an ATR at well over two times your stop loss and profit target - the probability of one or other of them being hit during the day is very high indeed. I'd happily bet on that - and heavily. As to which one gets hit first is anyone's guess!

TCO.png

So, what to do? If it were me, I'd have a much wider stop - say at least 2 x ATR above the current price. (This would put your SL at around the resistance level of $70.00 which, needless to say, is technically where some traders may try to go short!) Also, I wouldn't set a profit target - at least not one that's percent based. If you feel the need for a target, I'd suggest looking at something that's TA based and has some logic behind it, rather than an arbitrary number. That's not to say what you're doing is wrong and, if it works for you, that's all that matters. Also, while you're at work, if you're able to, take a gander at what the S&P futures are doing half an hour or so before market open. If they're trending up, then cancel your pending short order - especially if you're sticking with the 1% SL and profit targets. If you have pending orders to the long and the short side, then you could use the futures as a guide as to which to leave in place and which to cancel. Just a thought.
Tim.
 
Top