BigInTheCity
Active member
- Messages
- 134
- Likes
- 2
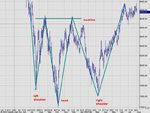
If my analysis is correct the Dow has reached its high for the year!
This was 9361.37 on 31st July 2003
Next stop the 7000s in my humble opinion
GL & GT
This was 9361.37 on 31st July 2003
Next stop the 7000s in my humble opinion
GL & GT