**dow - Warning**

BigInTheCity

Active member
Messages
134
Likes
2
If my analysis is correct the Dow has reached its high for the year!

This was 9361.37 on 31st July 2003

Next stop the 7000s in my humble opinion

GL & GT
 
do you have a time frame in mind for the 7000's and would you care to elaborate on your analysis?

The reason I am asking is because I dont have the final high until roughly the 8th of August. The price level would be substantially higher than we are now....
 
7000's!!!

You would have to see another Sept 11th Scenario before that happens.

The Dow is going to about 10000 before any serious downward movements.

Maybe you have your chart upside down!
 
i thought the same, the charts might be upside down,

lets take it seriously now,

sp500 im my p/f charts has given a sell signal at 983 and the buy signal will come in until sp500 reaches 1005.

for sure my numbers cant be upside down.

Genti
 
Hi all.

Here's my view on the chart

DJI03-08-03.GIF


The 9500 is proving to be a bit of a stumbling block at the moment and if the price drops below the blue line, then the double top will be completed and down we go. Having said that if 9500 does go then the magical 10,000 level could be on the cards.

IMHO it's too early to say :)
 
FTSE Beater

I think part of your chart is missing but I do understand your analysis.

Maybe we should call you Dow Beater instead!
 
Big in theCity- you should post some reasons why you think 7000.
FB, Here's why I think 10,500.
The DOW does deliver "W" bottoms, at least at intraday levels. As TA is supposed to be time independent, there is no reason that this W bottom can't deliver to 10,500.....
 

Attachments

  • ww.gif
    ww.gif
    23 KB · Views: 654
Interesting set of views.

I can't see the Dow exceeding 10,000 and 9500 is likely to provide a extreme resistance. Dow 7000 is far more attractive from a valuation perspective so has a higher probability, though the fact that there is a presidential election next year makes me allow for the possibility of a range-bound market for the next 12-18 months, before a severe drop into 2006.

I definitely see weakness over the next day or so and if the subsequent rally isn't strong then further weakness down to at least 8800 and possibly the support at 8500 by mid/late August. Cyclic analysis suggests a weakening market for the next few weeks.
 
The double top referred to by FB is, to my thinking, the top of a pullback. Looking at ChartMan's chart on his post, there has been no pullback of significance, so I reckonthe next move is a pullback.
 
rglenn said:
7000's!!!

You would have to see another Sept 11th Scenario before that happens.

The Dow is going to about 10000 before any serious downward movements.

Maybe you have your chart upside down!

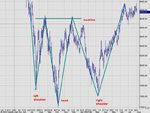
Head and Shoulders, we should atleast test the low 7000s
 

Attachments

  • dow jones index.bmp
    956.9 KB · Views: 294
We've also had the recent inverted head & shoulders too, which suggests a market bottom. It will be interesting to see what happens.
 

Attachments

  • dow daily 3 aug.jpg
    dow daily 3 aug.jpg
    72.7 KB · Views: 539
Well,

If we`re all going to predict, I say the Dow will test 15000 The only thing I`m not sure of is when

;)

Steve
 
BigintheCity

You are looking at a 10year chart.

This does not reflect the current market situation and trend.

A lot of things has happened since then.

I for one don't depend on charts as it is easier guessing the next direction from whats taken place recently- rather than difinitively depending on a chart which only shows what have taken place which may never occur again.
 
well my bet is a fade to 8600-8700 over the next month or two at worst unless Al-Quada do something in the US...
Otherwise substantially rangetrading for the rest of the year...
 
Skimbleshanks, the upside down shs you are referring to has not taken out the reaction high as yet so is still in the realms of the false break scenario. As for double bottoms and targets north of 10,000, it is all very well looking at technicals but there is no way fundamentals suggest a move anywhere near such levels...even at current prices some p/e ratios are at levels close to 2000 peaks. As of now there is no evidence of a second half recovery (even if some US policymakers believe that the more one talks about it the more likely it is to happen) and with fast dwindling momentum, there is a strong possibility that the market is set for a fall.
 
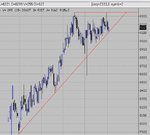
OK here's my two-penneth-worth, shown in the attached futures chart.

If you forget about the massive down spike from early July, then we are just sitting on fairly major sloping support imo, and this will probably be a pretty good test of it in the next few days...

So, I think we'll go up. Or we might go down. :LOL:
 

Attachments

  • dowfuts.jpg
    dowfuts.jpg
    48.2 KB · Views: 470
BITC,


I agree with you . I believe the dow is near it's high , it may well go up for another couple of 100 points , perhaps surprising us all the way to 10k , but then it's down again all the way .

IOW , this is a bear market correction .

I expect the dow to be lower than currently by the end of the year.
 
BigInTheCity said:
If my analysis is correct the Dow has reached its high for the year!

This was 9361.37 on 31st July 2003

Next stop the 7000s in my humble opinion

GL & GT

Very early days yet, but im still correct so far ...lol
 
Top