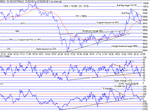
Excellent chart today. Lots here for everybody. Fibs, Triangle breakouts, Bull Flag. With a bit of poetic licence, it could be argued that the triangle breakout target was closer to 10K than 9982, but that's splitting hairs, and not so important as getting into the right ball park to have a target sell point..Lesser educated people may well have been panicked into selling at the big pullback at 9944 to 9926....BUT armed with the right tools...Fibs and Elliot wave principles, we all knew it was just a pullback, and a bounce on 62% was inevitable. 🙂 Also, if you take the last triangle formation,with the two peaks at 9897, this gave a target of 9942!!
You would have been forgiven for closing at 9982 target, losing just 15 points in a 100 point rally. Well done to Face (160 pts) and Skim (115).
The chart should speak for itself.....
You would have been forgiven for closing at 9982 target, losing just 15 points in a 100 point rally. Well done to Face (160 pts) and Skim (115).
The chart should speak for itself.....

