You are using an out of date browser. It may not display this or other websites correctly.
You should upgrade or use an alternative browser.
You should upgrade or use an alternative browser.
tradesmart
Experienced member
- Messages
- 1,286
- Likes
- 22
Yes CM, the prospect of a nice gap fill play at the open, but that’s gonna be one hell of big gap the way the numbers look at the mo’, and at times of extreme market momentum (which might be now….?!?) gaps are just left open, so I’m not shorting just yet……
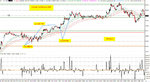
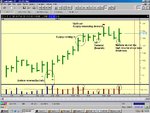
Well, support in the high 10300’s has withstood two stern tests provoking marked buying interest at this level, with some investors even prepared to place upbets on Friday night before the Iraqi elections (some bravery evident here……. 😕 )
From the current geometry, I’m looking at the possibility of a ‘W’ bottom forming which will be confirmed by a break north from the apex at 10532…and with the index at current 490ish futures levels, a down channel break looks highly likely, which is a further positive…
The target imho is the 61.8% retracement of the January falls at 10680 ish and I’m speculating on a retest (in time) of the high 10800’s; well within the well defined parallel uptrend channel on the 4hr chart, first mentioned last week…..
All of the above tends to represent my generally bullish views on developments since the Octobers lows (well documented on these threads….)
Anyone care to make a case for the bears based on chart T/A……?....... :cheesy:
Attachments
Bigbusiness
Experienced member
- Messages
- 1,408
- Likes
- 23
trendie
Legendary member
- Messages
- 6,875
- Likes
- 1,433
Bb, this is where I get confused !!
I looked at the charts and saw a 1-2-3.
1 = Jan-19, H = 10,626.
2 = Jan-25, L =10,369.
3 = Jan-26, H = 10,532.
I was mulling a SHORT, about now, to anticipate break through the "2" point of the 1-2-3.
Just when I thought I knew what was going on !!
edit: sorry about no chart, my PaintShopPro-7 keeps freezing.
Bigbusiness
Experienced member
- Messages
- 1,408
- Likes
- 23
roguetrader
Senior member
- Messages
- 2,062
- Likes
- 49
Just my humble opinion, but would be careful here, total market volume is coming in very light
tradesmart
Experienced member
- Messages
- 1,286
- Likes
- 22
Is that really a triangle???? I agree with Mega Bullish..... well, bullish anyway. I see the dip to 400 as the last gasp for the bears. The RSI shows an RS switch which might just hold. Plenty of room for some upside which will be confirmed with a push up through 500. Let's see what happens.....
Attachments
No chance to catch the gap and a good opportunity to short at the O/B top..... but for very little gain.Getting ot on the second touch on the 100EMA would have been the best bet..... assuming you didn't get out on the first one. One of those days where going long or short got you nowhere.. but no big losses either. 🙁
Attachments
tradesmart
Experienced member
- Messages
- 1,286
- Likes
- 22
Is that really a triangle????
You're not being influenced by the 'Chart Patterns - Tosh' thread are you CM......?..... 😆
or is it me.............. 🙁
TraderTony
Active member
- Messages
- 180
- Likes
- 1
Tuesday 1st February 2005
I hope everyone is well. I took a few days off at the end of January to paper trade and experiment after being disappointed by the start of the month. I'm not sure how productive it was but I think it's just something I need to allow myself to do every now and then.
I have continued to experiment with risk:reward ratios on trades and whilst my natural inclination is to maximise the win rate, I actually seem to end up with better results with fewer but much bigger wins. I have also started to believe that my 'edge' in terms of being able to anticipate whether the market is going up or down next is so small over random that getting it right twice in any trade (i.e. entry and then exit) is a really tall order and I'm probably better just worrying about entry where I can pick and choose exactly what I am looking for and then letting the trade play out to either the target or the stop loss (with the possibility of trailing the stop automatically).
I don't enjoy it yet as I hate losers and it can be desperate watching a trade that has been well in profit give it all up again before reaching the target but at the moment it seems to give me better results.
Well, so much for the theory, let's see how it goes in practise.
9:56 1) L 10495. Bouncing off 100 ema. Needs to get above 500. Which it didn't.
10:01 EXIT: -6.
10:03 2) L 10491. Try again. Nice move then again retraces from just over 500. Not stopped and up again. OK, eventually just below my 30 point target forming potential triple top. Tough to hold.
11:18 EXIT: +30. Got there in the end.
11:30 3) L 10518. Looks like it has run out of steam. Cannot even get 1 tick into profit.Then pushes to HOD but no follow through. Instincts say stop to b/e here (+6) but I still need to experiment with trailing stops (stop to b/e on the last trade would have taken me out, although there was a re-entry also good for +30). However, as I have a decent profit today I am going to do it - stop to b/e. Then another nice push up but stops dead at R2 (+18). Sorely tempted to cash in here and take the rest of the day off. But if I do that I'll always be second guessing so until I come up with a new rule I'll stick now for +30 or b/e. Looks like double top in so this could be over here. Maybe not. Up to +25.
12:09 EXIT: +30.
Wow - in at the bottom, out at the top - trust me, it doesn't usually work this well. Many losers amongst the occasional winner has been the norm over the past few days - but don't you just love a trending market.
I cannot bear to take any more trades right now - may have another go later.
Nope - cashed in and ran off to watch the footie.
+54 from 3
+51 for the day after commissions
+51 for February so far after commissions
Attachments
SOCRATES
Veteren member
- Messages
- 4,966
- Likes
- 136
But this is going to go higher, Chartman.ChartMan said:TT good stuff, but you seem to run very thin stop loss points...-5? The rest of your ideas are spot on ......
Tale of two targets, topping out on the magic 64.
VSATrader
Guest
- Messages
- 160
- Likes
- 26
I see supply coming at these levels, and although it may tick a bit higher, if you look at the Dow daily, you will see a top reversal in the background.
www.vsatrader.com
www.vsatrader.com
Attachments
Hi CM, "but you seem to run very thin stop loss points...-5?"
Would you care to expand on this.?
Forgive me for butting in TT !!!..
I am currently using a stop loss of 5 on a strategy of picking out the top or bottom of a run on the dow intraday, using some of the tools you have shared on these threads. The strategy looks for a minimum of 16 points but also letting winners run ....when being able to read the market correctly.. 😉