You are using an out of date browser. It may not display this or other websites correctly.
You should upgrade or use an alternative browser.
You should upgrade or use an alternative browser.
TraderTony
Active member
- Messages
- 180
- Likes
- 1
Wednesday 2nd February 2005
Well, it's that Fed announcement day again. Could be time to exercise, read a book, watch the cricket...anything to avoid chasing flat markets. Then again, it might surprise us.
Decent up move off 100 ema from 10:30 with many possible entries and +30 target reached with no heat on stops but I sat out. Too much flat market bias. Very frustrating - that would have done me for the day.
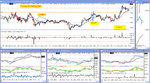
12:17 S 10579. So having stupidly missed the beatiful slow but steady upwards move I now end up going for a risky CT move albeit with a very tight (3 point) stop. Looking for +15 on this (5x stop). Stop to b/e at +3 on lack of movement. Stalls at 570 (+8). Then down to y/day's HOD (+11). Then +14 - 1 tick from target - and bounces. Ughhh. Heartbreaking. Looks like we've gone into pre-Fed mode now stuck with 569 level holding it up. And it looks like it is coming all the way back up. One more half hearted move back down but no follow through. This is dead.
13:29 EXIT: B/e. Expletives deleted.
Well, yesterday showed the best of the fixed stop/target approach, this trade showed the worst. I'll experiment with ways of trailing over time but for now it is just something I'll have to deal with. Makes you feel a right mug though.
I'm definitely out now at least until after the Fed announcement.
And then too volatile for me to find an entry.
B/e from 1
-1 for the day after commissions
+50 for February so far after commissions (2 days of trading)
Well, it's that Fed announcement day again. Could be time to exercise, read a book, watch the cricket...anything to avoid chasing flat markets. Then again, it might surprise us.
Decent up move off 100 ema from 10:30 with many possible entries and +30 target reached with no heat on stops but I sat out. Too much flat market bias. Very frustrating - that would have done me for the day.
12:17 S 10579. So having stupidly missed the beatiful slow but steady upwards move I now end up going for a risky CT move albeit with a very tight (3 point) stop. Looking for +15 on this (5x stop). Stop to b/e at +3 on lack of movement. Stalls at 570 (+8). Then down to y/day's HOD (+11). Then +14 - 1 tick from target - and bounces. Ughhh. Heartbreaking. Looks like we've gone into pre-Fed mode now stuck with 569 level holding it up. And it looks like it is coming all the way back up. One more half hearted move back down but no follow through. This is dead.
13:29 EXIT: B/e. Expletives deleted.
Well, yesterday showed the best of the fixed stop/target approach, this trade showed the worst. I'll experiment with ways of trailing over time but for now it is just something I'll have to deal with. Makes you feel a right mug though.
I'm definitely out now at least until after the Fed announcement.
And then too volatile for me to find an entry.
B/e from 1
-1 for the day after commissions
+50 for February so far after commissions (2 days of trading)
Attachments
TraderTony
Active member
- Messages
- 180
- Likes
- 1
ChartMan said:TT good stuff, but you seem to run very thin stop loss points...-5? The rest of your ideas are spot on ......
Tale of two targets, topping out on the magic 64.
I'm putting the stop 1 tick outside the swing high/low so it varies but is often around 6. If the target is +30 I have a few bites at the cherry but it is an ongoing experiment.
TraderTony
Active member
- Messages
- 180
- Likes
- 1
mojazz said:TT
Where do you get your pivot levels from?
They are automatically plotted on charts by Sierra.
TraderTony
Active member
- Messages
- 180
- Likes
- 1
DIN said:nice to see you back TT. thought you may have had a meltdown or something 😱
Cheers Din - not quite but the first few days back after Christmas were horrible and a bit unsettling. I felt I needed a few days to get my act together so went on that old quest for the Holy Grail, trying every indicator under the sun etc, before getting back to something (hopefully) nice and simple again.
A move up to yesterday's 'guessed' upper restance trendline.This takes us to T1 for the "W" bottom. So now it's crunch time.It seems there is room for more, with 650 the traget. This would need a breakout from the top res. line if it's going to go tomorrow....
Attachments
orky said:I have mytrack data realtime and Sierra chart set up. I can set up the 100 ema in the real time graph along with RSI and CCI but I have no lines..
Can anybody assist
I can only think that you are attempting to put both the cci and rsi in the same region. Could that be it?
Sorry if no help!
TraderTony said:Cheers Din - not quite but the first few days back after Christmas were horrible and a bit unsettling. I felt I needed a few days to get my act together so went on that old quest for the Holy Grail, trying every indicator under the sun etc, before getting back to something (hopefully) nice and simple again.
I remember you saying that from the start of this year you were trading for real income (or something like that) it's surprising the impact that can have.
It's a powerful thing the human mind.......
and those holy grails come up more often than you think.
off to watch the fokkers.
see ya.
frugi
1
- Messages
- 1,843
- Likes
- 133
Orky what exactly do you mean by having 'no lines'?
Perhaps the chart background is set to the same colour as the foreground? Check under Chart>>Graphics Settings Global. If not, post a screenshot if you can to clarify the problem and one of us can sort it out! 🙂
Perhaps the chart background is set to the same colour as the foreground? Check under Chart>>Graphics Settings Global. If not, post a screenshot if you can to clarify the problem and one of us can sort it out! 🙂
For "one of us" read FRUGI. :cheesy: seriously, someone will know if you post a screen shot...
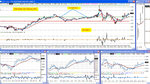
Not sure about that dip to 550.... Is that the start of lower highs already?Is that ND over 3 days?Confirmation bounce on CCI for the RS switch? Not sure it is...
Not sure about that dip to 550.... Is that the start of lower highs already?Is that ND over 3 days?Confirmation bounce on CCI for the RS switch? Not sure it is...
Attachments
TraderTony
Active member
- Messages
- 180
- Likes
- 1
Not much early direction.
11:00 1) S 10559. Doesn't take out LOD (except for 1 tick) and slowly pulls back to stop. Not good. Looks like consolidation but wants to take me out - each attempt to break back down fails. Long, lingering death.
11:39 EXIT: -7. Turned out to be right at the top of the pullback.
Missed the breakdown. Not that it seems to be going very far.
14:05 2) L 10577. Tight 4 point stop. Pulls up well but stalls at pivot. Stop to b/e at +6.
14:08 EXIT: B/e.
Jeez - what a day. Then it finally breaks in the last half hour - too late for me today.
-7 from 2
-9 for the day after commissions
+41 for February so far after commissions (3 days of trading)
Attachments
Thanks for your interest Fruigi
I do not now how to post a screen shot however I hope this helps. I have downloaded an historical and intraday dow chart. This just shows the price. I want to add the 100EMA to both. I have gone to Analysis, Studies and then added the 100ema and pressed ok. I would expect the 100 ema line to show on the chart but it does not. The same is the case with the CCI and RSI which I wish to add to the lower part of the screen. The only difference in the case of the RSI and CCI is that the screen shows the headings but no lines. Hope you can assist.
I do not now how to post a screen shot however I hope this helps. I have downloaded an historical and intraday dow chart. This just shows the price. I want to add the 100EMA to both. I have gone to Analysis, Studies and then added the 100ema and pressed ok. I would expect the 100 ema line to show on the chart but it does not. The same is the case with the CCI and RSI which I wish to add to the lower part of the screen. The only difference in the case of the RSI and CCI is that the screen shows the headings but no lines. Hope you can assist.
frugi
1
- Messages
- 1,843
- Likes
- 133
I'm a bit mystified actually.
So you've done Analysis >> Studies and selected "Moving Average Exponential", hit "Add" and it's appeared in the box marked "Studies to Graph". You've then hit "Settings" and set the EMA length to 100. In the top left of the Settings box is the colour to the right of "ExpMovAvg" a different colour from the chart background?
The fact that all 3 indicators are invisible suggest to me that somewhere the colour of the indicators is set globally to an invisble colour but I can't work out where, except in Chart>>Graphics Settings Global or the the Settings window for each study.
[To print a screenshot press the Prt Sc key on the top right of the keyboard, the open Paint, paste (Ctrl-V) the screenshot into Paint, then Save As a jpeg. to upload the jpeg use the Manage Attachments button which is below your message when you Post Reply. Press Manage Attachments, select Browse, find the jpeg, then Upload it with the button on the right.]