TraderTony
Active member
- Messages
- 180
- Likes
- 1
Friday 3rd September 2004
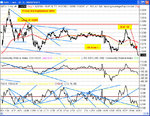
10:03 Prices coming down to 100 ema after ISM figures. O/S but follows multiple ND on the peaks (including yesterday). Difficult here to gauge likely direction off 100 ema. RSI/price ratio suggests this is a reasonably strong down move. NQ weak and failed to close gap earlier. Didn't take first bounce of 100 ema, which immediately looks like a bad decision but I feel it may jiggle a bit here.
10:17 TRADE ENTRY: Long 10285 on second bounce off 100 ema with single PD on RSI. Pulled up but didn't take out previous swing high and now appears to be forming a bear flag. Breaks to downside and into loss. Then back to top of congestion channel (3rd touch) but unable to break through at first attempt. Then breaks up but no real volume on ES. Sticks at 10300 level and drops again. Needs to take this out convincingly for long to have any mileage. Tries again without success. And down it comes straight into loss. New lows on NQ and long looks dead to me. Came to within a couple of ticks of being stopped on first few attempts down but then pulled back up on PD. Needs to get back above 100 ema though buy instead just seems to be bouncing off and back down again. It all says short, but the downside action is not really convincing. I guess this could be a large bull flag/triangle (seen better on the 10 minute chart). Will probably be stopped out before it breaks up though.
11:40 OK, third touch on upper channel of possible triangle and peeps over but RSI now O/B and CCI right at zero line so another down move seems inevitable. Ran along upper edge for a while then appears to break up but no volume. I calculate T1 would be around 10338. No upside movement though and potential H/S to downside. Could just be reloading RSI for next move up but this action is making me very nervous. Back below 100 ema and trade into loss again. The slowly crawls up towards 300 but getting v.heavily O/B. Never got there.
12:39 Breaks back down having failed to reach 10300 and quickly into loss. Not really sure what's happening here and not liking it as it falls below the 100 ema again. Runs sideways forming bear flag and then breaks down. This is going to be a slow death as it drifts down again.
13:44 Still going nowhere but failure to take 10290 to upside sends it down again.
14:16 Breaks to upside after completely flat then straight back down and into loss. That could be that. Fake out.
14:25 Dropping like a stone. Then back up. Oh what a crazy crazy frustrating day. Faking the fake outs. And down again. This time I'm done for.
14:46 New LOD just above stop but this is dead now if 64 fails to hold.
15:05 ES pulls back up to its 100 ema. The Dow hits 100 ema. Needs to keep going up up up. Stalls at 280 - earlier support. Potential reversal back down off CCI zero line. And down it comes back below 100 ema. Bull flag or chance to enter short?? Tries another push up but stalls again at 80 (or 81). And after over 5 hours my trade is back at entry with just over thirty minutes of the week to go. Next test 90 but heavily O/B now.
15:27 Pokes over 90 but stops quickly. Perhaps a retrace and final push to 300 or even HOD (now I'm really getting carried away). No, it's falling rather than consolidating. Back below 90 and picking up speed. Ugh. No sign of another move up. Odd. Time running out so looks like it's now or never for the upside. And it keeps coming down. That is truly horrible.
15:46 NQ and ES have one last attempt up but no follow through on Dow or YM and then it comes down even more.
TRADE EXIT: At close. -18.
-18 for day from 1
+2 for September so far
What a miserable way to end my first three days back from holiday. Shouldn't have bothered.