You are using an out of date browser. It may not display this or other websites correctly.
You should upgrade or use an alternative browser.
You should upgrade or use an alternative browser.
Bill
Active member
- Messages
- 160
- Likes
- 1
Hi
Not so good today
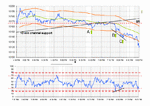
A Long rule 2 [half trade]. Moved stop to BE. Stop taken for 0 points
B Long rule 2 [half trade]. @10158
C Long rule 4 [half trade]. @10145 Stop taken @ 10131 for -20 points
Of course the clues were there. The Support @ just under 10170 was broken after 6.00pm and also CM's 10min channel support line went around then. There was a pullback confirmation to retest these two [now] resistance levels. This should have been the clue I needed to scrap the +-15 rules and go short. I even saw them real-time...... Just stupid I guess! Still not too much damage done.
Regards
Bill
+-15 ema Rules are
1. Short if price crosses 100ema and touches/crosses 100ema+15
2. Long if price crosses 100ema and touches 100ema-15.
3. Short if nd and/or price is 100ema +15 [or v close]
4. Long if pd and/or price is 100ema -15 [or v close]
5. Don't trade in the 1st hour
6. Stop losses above/below obvious SR
Attachments
Dear HINDSIGHT - I predict the close will be between 10120 and 10130.
My twopence on today's action ...
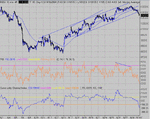
Nice bounce off 64 again (chart 1 attached), I think it's the third time in the last week I have taken a gamble on a bounce off 64 and it has paid off.
Triangle formed with a mouth at A giving a target of +/-35, target met (plus a bit more) at point B.
Hope you all had a good day's trading!
Justyn.
Attachments
Bill
Active member
- Messages
- 160
- Likes
- 1
Dear HINDSIGHT - I predict the close will be between 10120 and 10130.
Ah yes Justyn.... very easy with HINDSIGHT! 🙂
Bill
EDIT
Sorry Hindsight forgettin' me manners. Welcome to the Dow thread. Best on the net. Have a look at
http://www.trade2win.com/boards/showthread.php?t=5785
if you want to see what it's all about. [Please ignore naff joke]
Last edited:
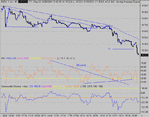
Good take off 64, but don'dt push your luck, J. That was probably the trade of the day.... the reast of the day went sideways, developing into a bear triangle with T1 target. It struggled to get there, but made it in the end....
I thought the SR switch would do the biz, but it failed at the close....
I thought the SR switch would do the biz, but it failed at the close....
Attachments
hindsight
Junior member
- Messages
- 27
- Likes
- 0
Bill said:Ah yes Justyn.... very easy with HINDSIGHT! 🙂
Bill
EDIT
Sorry Hindsight forgettin' me manners. Welcome to the Dow thread. Best on the net. Have a look at
http://www.trade2win.com/boards/showthread.php?t=5785
if you want to see what it's all about. [Please ignore naff joke]
Thanks for the link Bill, I got caught out today was long 184, got stopped out, then reentered again long at 151, next stop is at 101 on a december contract. Looking at the screen now theres a chance im going to get stopped out over night.
tradesmart
Experienced member
- Messages
- 1,286
- Likes
- 22
Right on cue, a reversal as the Dow hit the 61.8% fib retracement level of the last major downleg with ND on RSI showing the way……..10220ish has been a major S/R fulcrum level previously and a break of this could result in some decent upside imho.
Major economic data is being released this week with the ISM index on Wednesday and NF payrolls on Friday; and market reaction to these numbers will clearly drive the charts……
10220 could have a retest imho…..
(speculation......speculation........... 😉 )
Major economic data is being released this week with the ISM index on Wednesday and NF payrolls on Friday; and market reaction to these numbers will clearly drive the charts……
10220 could have a retest imho…..
(speculation......speculation........... 😉 )
Attachments
FetteredChinos
Veteren member
- Messages
- 3,897
- Likes
- 40
FWIW chaps, im favouring a drop to 10,080-ish today, before a hefty bounce up until thursday afternoon.
it appears to be the most likely of the 3 scenarios that could be in play this week.
could all go tong though..
FC
it appears to be the most likely of the 3 scenarios that could be in play this week.
could all go tong though..
FC
FetteredChinos
Veteren member
- Messages
- 3,897
- Likes
- 40
getting close eh?
still looking for a strong-ish bounce soon..from 10,085 ish
still looking for a strong-ish bounce soon..from 10,085 ish
FetteredChinos
Veteren member
- Messages
- 3,897
- Likes
- 40
not done yet 🙂
reckon it might have another stab in the nether regions...
right, am off home now. orders are in. i'll survey the bodies on the battlefield tomorrow...
reckon it might have another stab in the nether regions...
right, am off home now. orders are in. i'll survey the bodies on the battlefield tomorrow...
FetteredChinos said:FWIW chaps, im favouring a drop to 10,080-ish today, before a hefty bounce up until thursday afternoon.
it appears to be the most likely of the 3 scenarios that could be in play this week.
could all go tong though..
FC
Excellent forcast,could i ask what made you predict 10080 as the bottom today?
Many Thanks
Llew
FetteredChinos
Veteren member
- Messages
- 3,897
- Likes
- 40
hi mate, cant really say in any great detail..
what i can say, is that we had moved sufficiently from previous close levels, and coupled with daily patterns, a low in the region of 10,080 looked likely.
current target for this bounce is about 10,200. then looking for a reversal south on thursday in the 10,260 region.
lets see if it pans out.
good trading all.
FC
FetteredChinos
Veteren member
- Messages
- 3,897
- Likes
- 40
credit must go to other people im afraid, much as i would like to take it myself, i would feel wrong to do so.
righty ho, signing off now.
toodle-pip chaps.
FC
righty ho, signing off now.
toodle-pip chaps.
FC
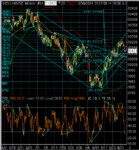
I was wondering the same thing, so I took a closer look. Not being one for looking too close at Horizontal support/res lines, I messed the obvious. I prefer to work in channels, mostly. You can see from the chart that 10,080 is a clear support possibility. Chinos got there by a different route it seems.This current move has a target of 190... Is this the mother of all pullbacks to take us to infinity and beyond? TradeSmart will know.....
Attachments
FetteredChinos
Veteren member
- Messages
- 3,897
- Likes
- 40
CM, sorry to butt in, just as i was popping out the door. had a look at your charts/indicators.
looks as though we have hidden divergance on the longer term. ie higher low in price, lower low in indicators, or as near as dammit.
as far as i can recall, this usually is a sign of a pullback rather than change in trend isnt it? our indicator experts may be able to help. but i would say that the move up has considerably more room to go...
🙂
FC
edit:- must stress in the longer term , not necessarily this week!!! but then again, who knows..

