You are using an out of date browser. It may not display this or other websites correctly.
You should upgrade or use an alternative browser.
You should upgrade or use an alternative browser.
tradesmart
Experienced member
- Messages
- 1,286
- Likes
- 22
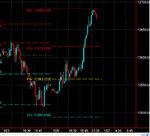
Another triangle in the making! – I’m long on this from the first bounce off the 100ma at 10570 on the 1 min chart.
The bull flag and the triangle appear to insinuate a target of c.10640 ish……..
I suspect that a retest of 10660 might happen soon – it has been re- testing every new high very promptly recently………but there are no certainties..
The other option is that we are forming the 2nd shoulder of an H&S, in which case I will very quickly become short….. :-0
Well, Chartman was saying on Friday that we should trade with an “adaptive” system… 😉
Attachments
One Eyed Shark
Well-known member
- Messages
- 257
- Likes
- 13
TS ~"RESPECT!"~ :cheesy:
We are also still working within the 10 min channel from last week, will a breakout to the upside send us into orbit?
We are also still working within the 10 min channel from last week, will a breakout to the upside send us into orbit?
tradesmart
Experienced member
- Messages
- 1,286
- Likes
- 22
OES - respect to your channel, it's that that's working the magic imho - it certainly called the bottom on Friday!!
It's good when a plan comes together..... 😎
I suspect that there is more upside to come in accordance with the 'one step backwards/two steps forward' rate of progress that we are now following......
It's good when a plan comes together..... 😎
I suspect that there is more upside to come in accordance with the 'one step backwards/two steps forward' rate of progress that we are now following......
Looks like we going to settle for lines 1 & 2. Is it possible, that during a bull market, the path of least resistance is across the peaks, as opposed to the "best fit" line? And conversely, in a Bear market, the support line will be on the trough peaks? Food for thought......
764 tomorrow, eh TS ? :cheesy:
764 tomorrow, eh TS ? :cheesy:
Attachments
tradesmart
Experienced member
- Messages
- 1,286
- Likes
- 22
it's certainly extended CM....!
closed long at 10700 - it had to get there after it sliced through 640/660......!
11000 not so far off now........ :cheesy:
wouldn't mind 'upgrading' my Dow Comp entry in the light of today's performance....... 😕
edit - perhaps I should have held overnight for the '764' ?!?
closed long at 10700 - it had to get there after it sliced through 640/660......!
11000 not so far off now........ :cheesy:
wouldn't mind 'upgrading' my Dow Comp entry in the light of today's performance....... 😕
edit - perhaps I should have held overnight for the '764' ?!?
Why people fight the trend is beyond me. 🙁 Going short near support has to be nothing short of madness in this market....
Two nasty traps today- most unusual. The first taking the triangle on the break was an instant loser as the target T1 was missed. The second was the following bear flag- taking the short as it dropped through again led to an instant loss as T2 failed. I reckon the MM's must have been reading this thread over the weekend and figured out how to put a spanner in our works. Anyway,here was the key.... RSI strength on the exit of the bear flag to 583 was just so weak there was only one likely outcome. then came the RS Switch on CCI. It didn't show in RSI because of the drop to 40 at the point marked 'entry'. That took us straight to 700 with hardly a sniff of a pullback- except for a quick test at 64. If you looked for the 3 pk ND out, you would have been rewarded with another 100.
TS got in at the optimum at 570. Did he ride it all the way up?
Hard choices . Do you follow targets? ( preferred in a rally) or do you follow the 100EMA? The former undoubtedly cost points today, the latter was worth 130.
Attachments
I think that would have been a mistake, TS . Every time we bang up against RSI res. we tank. We just hit 80 tonight and peeped over the top of the channel.Have to see how it develops tomorrow. Clearly, all the drops to RSI support are not tanking the price, giving room for never ending pushes up. Well, almost never ending. I guess you chickened out at 700... there was still 8 minutes to go and 5 more points. :cheesy: :cheesy: :cheesy:
Well done that man! On second thoughts, I guess you waited for the 3rd RSI peak and hit the nail right on the head!
Well done that man! On second thoughts, I guess you waited for the 3rd RSI peak and hit the nail right on the head!
One Eyed Shark
Well-known member
- Messages
- 257
- Likes
- 13
Is this the way for the next 10 months ???? or in other words is it time to hold a trade overnight :cheesy:
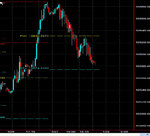
Been following the longer term chart over the last few weeks, today we broke out of the channel from the high of Jan 2000, not only that but this current move has some fuel behind it. The last two high's in 00/01 came out of rangebound trading with some ND on the momentum indicator, this one seems to have the legs to keep going fast, 11250 next stop ?
With a bullish statement from the Fed on Wednesday maybe even sooner than we think. 😀
Attachments
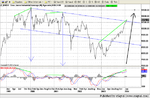
I don't think anyone should get carried away by what happened in 2000/2001. Is it really relevant to what people are thinking today and tomorrow? Will every man jack and his dog see this and think we're on the way to the moon? I don't disagree with 11250, or any other figure, but take care, please. And no, there are very very few occasions where it might be worth holding overnight. If you must, keep the stake small. 100 points against you is gonna hurt. Why take the risk?
Hi Guys
Just out of interest one of the tools i like to use is the pivot points, and most days they work reasonably well in finding good support or Resistance areas, as you can see friday and today they found the tops and bottoms, within 1 point today and most days within a handful of points, great tool and worth a look.
Regards mark
Attachments
Hi mombasa
The tool i use is for tradestaion,but if you do a search on the net you can download a calculator there are plenty about, i think the subject has been covered on this site so maybe worth doing a search, nothings 100% all the time but i find it gives a good idea of possible turning or support / Resistance areas, itl probably prove me wrong today but here are the numbers i got. 10783, 10727, 10630, 10574.
Regards mark
Nothing much of interest today. Except there was some discussions elsewhere about whether RSI has any merit as an Oversold/Overbought indicator, so I put my oar in... Today is a nice example.. The first half of the session sees RSI with an average low of around 33. Then we see it tank to 20. Does this tell us we're well oversold? It does if we take the first half session as a "yard stick". You can't just say that 20 or 25 or 30 is oversold ( nor 70/80/overbought) without some form of reference point. The overbought "average" today was 57 so at 66 and 77 we can guess that we're well overbought. Any thoughts ? I would think this ties in with RSI strength ideas.....
We need to figure out where support is going to be tomorrow. Line 2 or line 3?( 10 min chart). 600 is horizontal support, so I attach more substance to that than 550 which seems to be in "fresh air".
We need to figure out where support is going to be tomorrow. Line 2 or line 3?( 10 min chart). 600 is horizontal support, so I attach more substance to that than 550 which seems to be in "fresh air".
Attachments
Similar threads
- Replies
- 74
- Views
- 14K