You are using an out of date browser. It may not display this or other websites correctly.
You should upgrade or use an alternative browser.
You should upgrade or use an alternative browser.
tradesmart
Experienced member
- Messages
- 1,286
- Likes
- 22
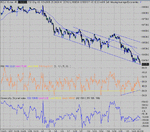
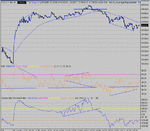
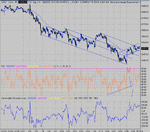
The YM March futures chart ,as it merges from the 2004 contract to the current, shows that the Dow found key support at around 10340 ish when it was trading in a similar range last year….
No certainties that it will this time round, but it could be a level worth watching imho…… 😎
But the bare fact is - this market is going to need a big postitive catalyst to force a change of direction - at the moment it's only finding negative ones....... 😕
No certainties that it will this time round, but it could be a level worth watching imho…… 😎
But the bare fact is - this market is going to need a big postitive catalyst to force a change of direction - at the moment it's only finding negative ones....... 😕
Attachments
Last edited:
tradesmart said:The YM March futures chart ,as it merges from the 2004 contract to the current, shows that the Dow found key support at around 10340 ish when it was trading in a similar range last year….
No certainties that it will this time round, but it could be a level worth watching imho…… 😎
But the bare fact is - this market is going to need a big postitive catalyst to force a change of direction - at the moment it's only finding negative ones....... 😕
How about 9100 - end of April early May?
tradesmart
Experienced member
- Messages
- 1,286
- Likes
- 22
How about 9100 - end of April early May?
Yeh - but which day........?
29th April / 3rd May.......?!?
You gotta be more precise......!
😉
(and what year anyway.....?????)
tradesmart said:Yeh - but which day........?
29th April / 3rd May.......?!?
You gotta be more precise......!
😉
(and what year anyway.....?????)
Is that a necessity ?
8-10% isn´t that bad? :cheesy:
tradesmart
Experienced member
- Messages
- 1,286
- Likes
- 22
Well, at the days highs it was nearly 150 up wasn’t it…..?!?Posted by TradeSmart (sometimes known as Mystic Meg..) last Friday..
"one good 'spark' could ignite a 150 point rally fuelled by short covering imho...."
Some suckers can just read the ‘tape’ can’t they( 😆 ), but I didn’t say what day because no one asked me…(!)....MaxPain could’ve no doubt though……. 😉
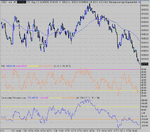
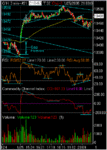
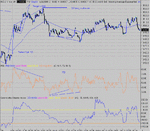
Maybe CM, but I see today’s move up as part of a possible ‘bottoming’ formation around the 38.2% fib level of the big move up from 9700 – 10875 (4hr chart) and a c.500 point retracement from the highs has been fairly standard judging from the waves that we saw many times last year…Posted by CM today...
"So, a poke at 500 tomorrow?"
I recall the old traders saying “the bigger the fall, the broader the bottom” – so the consolidation may play out, testing the lows, for a while yet…
There has been some talk of a “dead cat bounce” but when the market has become depressed, there are many bears about, but they quickly change their tune as the market rises against them – time will tell…!
But, I also note the ‘gap up’ (3min chart) left from today’s action that may well have to be filled before a sustained move up………
Hope that the above reads ok – just returned from a Burns Night supper, during which I became well acquainted with ‘Laphroaig’……. :cheesy:
Attachments
Last edited:
tradesmart
Experienced member
- Messages
- 1,286
- Likes
- 22
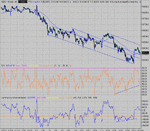
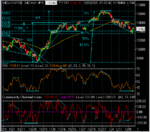
We may be seeing the start of a BIG parallel channel connecting the recent highs / lows that may determine the ‘shape’ of things to come for the foreseeable future…..
Purely speculative comment for now, but well worth watching developments around the lower line imho……
Purely speculative comment for now, but well worth watching developments around the lower line imho……
Attachments
tradesmart
Experienced member
- Messages
- 1,286
- Likes
- 22
Novice
I use the YM futures chart as obviously trading YM as I do, the chart is reflecting the price that I trade at....
The futures price typically moves ahead of the so called 'cash' and is more volatile.......
I think that there is a good justification for using the futures charts even if you are spreadbetting, as the SB's prices are based on futures price movements, but with an adjustment (!) to bring them in line with the cash...
But, beware - different SB Co's use different algorithms to incorporate their spread, so variations occur when compared with the 'realtime' cash price....
For longer term charting, the geometry of the YM and cash charts are near identical if you exclude the pre/post market action on YM......
all strictly imho...
Last edited:
tradesmart
Experienced member
- Messages
- 1,286
- Likes
- 22
I generally make the decision to trade based on YM chart signals in several timeframes, typically 1/3/10 min, but when it comes to ‘pulling the trigger’ I’m concentrating almost exclusively on YM 1min candles, trying to buy or sell the low/high of a potential move to within 5 points…..
I don't find the cash price to be of any use at the point of trade.......
But this is a personal style that I've developed - you will have to find your own 'comfort zone' and acceptable margin for error at the crucial trading moment....
HTH…!
I don't find the cash price to be of any use at the point of trade.......
But this is a personal style that I've developed - you will have to find your own 'comfort zone' and acceptable margin for error at the crucial trading moment....
HTH…!
Last edited:
QUOTE BY CHARTMAN:
I knew I should have bet on it.... PD comes good, jumping up two levels onto support. So, a poke at 500 tomorrow?
-----------------------------------------------------------------------------------------------------------------------chartman: WOW you could have bet on it. 😆
I knew I should have bet on it.... PD comes good, jumping up two levels onto support. So, a poke at 500 tomorrow?
-----------------------------------------------------------------------------------------------------------------------chartman: WOW you could have bet on it. 😆
tradesmart
Experienced member
- Messages
- 1,286
- Likes
- 22
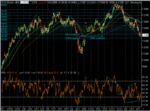
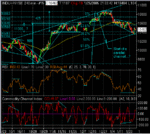
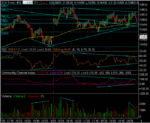
An 80 point triangle constructed as a result of yesterday’s mostly inside action…...
But the futs now sinking to the south as shown on the sidebar, may well indicate today’s direction……
Data at 13.30 and anticipation of MSFT (among others) reporting today, may have some influence imho…..
But the futs now sinking to the south as shown on the sidebar, may well indicate today’s direction……
Data at 13.30 and anticipation of MSFT (among others) reporting today, may have some influence imho…..
Attachments
TheBramble
Legendary member
- Messages
- 8,394
- Likes
- 1,171
Get's my vote too. If it breaks down thru 10480 without stopping and continues through 10460 (without a significant halt) my target is 10360.tradesmart said:But the futs now sinking to the south as shown on the sidebar, may well indicate today’s direction……
Similar threads
- Replies
- 25
- Views
- 8K


