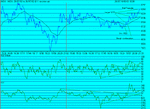
Dow Intraday charts 22/07 26/07

ChartMan

Legendary member
Messages
5,580
Likes
47
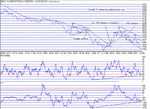
Another high volatility day today with about 800 points up for grabs.....First to go was the triangle failure, as it broke to the downside, with the balance of the triangle under the 100MA, it was to be expected. This led to a tripple test and eventual failure to hold 7800. The Inverse H&S that developed off the bottom at 7725 finally performed, breaking the 100MA on the retest of 7823, a long way off the bottom. A hard pill to swallow, if waiting for confirmation on the 100 break. A shakey ride to the top and an H&S developed,finally breaking the 100MA 175 points from the top- another big swing before confirmation.
Could be worth moving to 49MA in the current volatility, but we know what happens when you change strategy...scalping today could have proved very profitable with the large swings on offer....
Comments in the chat room - a hard day- some gained 600 and lost 400 points...ending net 200.
 

Attachments

  • 22-07-02.gif
    22-07-02.gif
    17.8 KB · Views: 466
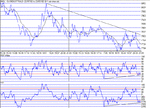
Plenty of volatility again today, along with some good moves under the 100MA, but plenty of whipsaws around too. No solid TA to help the bank balance, save a H&S and an Inv. H&S...Roll on when a real bottom sign appears.:)
 

Attachments

  • 23-07-02.gif
    23-07-02.gif
    19.1 KB · Views: 435
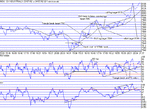
Great day, to say the least. TA performance and features were in abundance, with each successive formation being confirmed and exceded. The texts should be self expanitory. Even trading the 100MA break off the first triangle and closing at the downside cross would have netted 200 points. Taking the second triangle break would have netted another 200 odd and the tea time traders should have managed to get that one. I must say it makes a very nice change to see some decent TA all falling into place again.I'd almost given up looking for something to happen that was even remotely interesting. There is only so much one can say about a continuous down of 1900 points. YES! thats how far it's dropped since the 4th. of July.Now if we go up 1900, that would be really nice and there will be lots to see, I'm sure. I just can't remember when we last closed at HOD....
 

Attachments

  • 24-07-02.gif
    24-07-02.gif
    18.2 KB · Views: 384
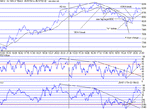
Not surprisingly the futures opened down 60 or so but were soon halted, leading to an overnight continuity forming a 3 pk nd top.Plenty of volatility here with 150 point swings. The short signal was not long coming and sigmnalled a good short entry. The bear flag that followed probably fooled most with it's 60 point swings, and just breaking out of the 100MA giving a whipsaw. Weez thought she had covered here, but inadvertently doubled her position.....to her great benefit later.:)
Given that, and getting back into a short, there was a good fall to the bottom, all under the 100MA. Picking the bottom at 7944 could have been tricky, but there were 4 resistance slope changes from the top... This bottom was confirmed on the next higher low, and an RS switch. This also formed an Inv. H&S that took a long time to break the 100, due to the rapid drop to 7944.( also a "W" bottom) Still, that gave the tea time traders 150 points ...catching the drop would have given another 150 or so.
Another 900 or so points on offer today. JP got 500 of them and Skim had her best day ever for points and % cash gain.
 

Attachments

  • 25-07-02.gif
    25-07-02.gif
    17.4 KB · Views: 343
A tricky day, until towards the end. It just didn't know where to go. In the end we got a good bottom call with in Inv. H&S that broke and pulled back to the 100MA before finally moving up for a 100 points or so. Plenty of volatility again, but few clear cut TA pointers. Notice the bull triangle breakout...... a strange formation.
Notice also that neither RSI or CCI formed a complimentary bull triangle. They formed a bull flag.
 

Attachments

  • dow intraday.gif
    dow intraday.gif
    18.8 KB · Views: 355
Top