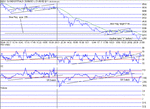
Dow Intraday charts 17/06 - 21/06

ChartMan

Legendary member
Messages
5,580
Likes
47
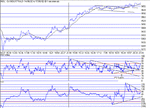
A good trading day for the bulls.Up 60 or so points at the open, and nice steady rise till the lunchtime break, testing 9660 area 3 times....Finally breaking to the upside to close at HOD of 9687.Nothing very exiting today, but notice the dow's inability to drop on TA weakness, (18:16) RSI 30/ CCI -104 from the opening highs of 70,176.note the RS switch, and the developing triangles on RSI and CCI....
 

Attachments

  • 17_06_02.gif
    17_06_02.gif
    16.2 KB · Views: 426
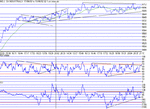
Steady trickle on up following on from yesterday's failure to drop on wealkness, closing up 32 odd points.Barring the odd excursion, the whole day was spent inside the 100MA +/-20.Very boring and very hard to trade. Getting any points today would have been lucky .....Tomorrow may be better having seen after hours is up from the close....Triangle forming on CCI that could lead to a breakout, having closed just above the resistance of 9706.That would take us to 9800 ish.
Bad news has made the dow Futures drop by over 100 overnight...currently 9600
 

Attachments

  • 18_06_02.gif
    18_06_02.gif
    16.3 KB · Views: 412
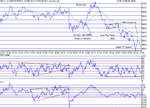
Well no breakout... but a great trading day with over 200+ easy points to be had....Picking up after the open drop we had an Inverse H&S close to the 100MA, offering a good entry at 9650.That had a target og 9668, just above the prior peak.That ran all the way up to 9732, pausing at 9686/94 on the way up. The top was confirmed by an almost perfect 3 pk nd top, even though it was on the limit of the time slot at 26 minutes. 4 ticks around 30-33 gave an easy out at the top... The reversal confirmation didn't come until the 100MA cross at 9694. This delay was due to the 3 pk top being relatively short.. The TB's would have reversed at the top I guess... That reversal and short entry stayed under the 100MA all the way to close. The Bear flag in the middle gave a target of 9550, that eventually performed. Note the failure to break the 100MA on the last cycle of the bear flag, confirming the down trend continuation. The "V" at the end was the sting in the tail,but again failed to break the 100MA falling 5 short before finally wilting into the close some 150 points down on the day. The Tea time traders should have had a good time, getting in on part of the big drop, just as the bear flag dropped out of it's up trend support....good for 80 odd points, and a few more off the bounce...
 

Attachments

  • 19_06_02.gif
    19_06_02.gif
    17.1 KB · Views: 332
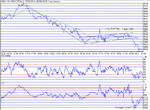
The failed "V" bottom last night should have been taken on board. Although there was not much action today, Skim spotted the long bear flag forming. This lead to a substantial drop... Two things here. The bear flag has a target of 9285, well below the suggested RS switch target on the 10 min chart. The other is the possible divergent bottom, countering that. We were reminded today on numerous occaisions that it is tripple witching time, and this may account for the strange TA and price.
 

Attachments

  • 20_06_02.gif
    20_06_02.gif
    16.8 KB · Views: 297
Total down day, spending just about the whole time under the 100MA. Yet again a longer time scale bear flag developed giving a target of 9100 ish. The same formation and brake down as yesterday. Spooky. We even got another failed "V" bottom, just as we did earlier in the week (19th)....Seems the up trend in RSI and CCI suggest upside support, right up to the point of falure, producing an SR switch.
 

Attachments

  • 21_06_02.gif
    21_06_02.gif
    15.8 KB · Views: 275
Top