Dow Intraday Charts 16 Aug - 20 Aug

Looks like we have a bullish breakout through the top line of the downtrend channel at the third attempt, but RSI is high and becoming divergent so today’s performance could determine whether we are at a short term ‘top’ and due for a pullback imho

Also the index is approaching a band of potentially resistive congestion at current levels…….oil now hitting $47.50/b today - should create some 'resistance' soon......!?
 

Attachments

  • 19-08-04.gif
    19-08-04.gif
    27.3 KB · Views: 257
An update from a few weeks ago when I suggested the price had failed to touch 3rd support. Plenty of room on RSI and CCI for upside. Maybe not today though as TS suggests.
 

Attachments

  • Image1.gif
    Image1.gif
    25.5 KB · Views: 289
Spot on TS. Straight swing between the channel limits, and back to the mid line. Wonderful things these channels. Especially if you get them right!
 

Attachments

  • dow 19-08-04 10.gif
    dow 19-08-04 10.gif
    40.5 KB · Views: 254
The top MA i( yellow) s the "least squares moving average" from Sierra,set at 150. Does this help resolve those tricky "open" decisions? It picks the 3rd peak on the 3 pf PD bottom. Does it always do that? For the answers to this and much more, you must do some homework....
 

Attachments

  • dow 19-08-04 1.gif
    dow 19-08-04 1.gif
    27.3 KB · Views: 278
Hi

Another day another dollar........less

A Short rule 3. Although the 'v close' bit in rule 3 is stretching the rules a bit.

B Long/close rule 2

C Short rule 1

D Short rule 3

I regard this as a complete failure. As I said last week the system is very likely to put you on the wrong side of the market. It's sort of a gamble on the type of day it's going to be.

I don't get home from work until after 5 so A was not possible. That B trade upset me. Does anyone else feel this way? -> I'm sure I've seen that pattern of gradual deterioration [5.00 to 6:30] before. If you stare at the screen for enough months/years history does repeat itself. For that reason I ignored B which has mucked up the experiment a bit I suppose. Anyway I did take the C short at 10026 which duly stopped at 10050. Perhaps I should have used 10055 as that is just above Res. Rule 6. In any case -24 today. I wouldn't take a trade at D, it's too late. If you count the trade I should have taken at B then it should be up to -48?ish.

Note this is a simulation using Capital Spreads.

If you modify the dow rules to allow a pd/nd entry [normally it's an exit indicator] then the Dow strategy was a resounding success and I suspect there were a lot of winners today. I reckon you could have picked up ~100point no problem. Please post if you did. [Smiley face will do]

Options expiry tomorrow I think?

Regards

Bill

Rules are

1. Short if price crosses 100ema and touches/crosses 100ema+15
2. Long if price crosses 100ema and touches ema-15.
3. Short if nd and/or price is 100ema +15 [or v close]
4. Long if pd and/or price is 100ema -15 [or v close]
5. Don't trade in the 1st hour
6. Stop losses above/below obvious SR
 

Attachments

  • dow_190804.gif
    dow_190804.gif
    32.8 KB · Views: 189
CM - first I'd like to add my congratulations and gratitude for your immense effort in posting on these boards.

And a warning about my post - lots of waffle I'm afraid, but I've left it as came out.

Thursday 19th August 2004

All futures indices gap down on open.

9:32 DJ hits 100 ema at 10053 and moves sideways with low at 100051.

9:44 No second test of lows and starts to move up off 100 ema to close gap. Should probably be long here but waited for PD on a dip down to LOD which never happened. Instead the higher low was probably enough to risk one (but caution perhaps more sensible with Leading Indicator figures due out at 10).

9:59 Gap closed on ES, already done so on NQ but not yet on YM or DJ. Markets then immediately drop down (news or gap closing?). DJ hits 100 ema at 10058 but no direction yet.

10:17 TRADE ENTRY: Long at 10058 (10059 YM) on second pull back over 100 ema with CCI bouncing off zero line but instantly falls back down again. Tight flag and should have entered nearer the bottom support to minimise risk. Dreadful entry - kicking myself very hard.

10:23 New LOD and all futures markets break to downside. This week I am getting this first entry completely wrong - getting very frustrating as I am always having to play catchup.

10:29 TRADE EXIT: Stopped out -22.

11:04 Price back to 100 ema from below at 10046.

11:09 TRADE ENTRY: Short at 10044 (10045 YM) on pullback from 100 ema with TLB on RSI and CCI. Seems unable to break away from the 100 ema though. And keeps on going up.

11:23 100 ema becomes support and now it's off up. I'm getting everything wrong today. I have not enjoyed this week at all - I seem to have been in losing positions virtually the whole time. No doubt up to HOD now and another stop out.

11:45 Cannot break back down below 10050. And up up up again. Long is the only place to be.

11:57 Spiked down below 100 ema and to trade entry just ahead of numbers - no doubt will shoot back again even quicker in a couple of minutes. Yep, there it goes. It just won't go down.

12:12 Jumping back and forth over the 100 ema but looks certain for a break to the upside next. ES leading it up.

12:32 There it goes up.

12:37 Internet connection down.

12:52 Possible breakout to downside just a fake and ES bounces back up again. No volume either. 100 ema absolutely flat at 10050 level.

13:30 Right on the dot of 1:30 it fakes out to the downside and spikes back up. Everything says this is going up to me whenever it finally moves.

13:37 Finally some downside and trade actually goes into profit. Needs to take out 100 ema -20 for me to have any confidence in it though.10032 may hold it up though. But it is already very O/S on RSI and CCI so may just spring back from here. Yep - back it comes. Desperately needs another hard push down.

13:48 Multiple attempts to break down through 10032 failed so still inside 100 ema -20 and moving back up again. Also failed to take out LOD. Could be a bear flag now.

13:55 Broke down to new lows and hit LOD where it stalled with big potential PD. Still not 20 below 100 ema.

14:00 LOD holding and pulling back now on big PD. Triple divergence would be suggested for peak down at 14:10

14:03 LOD fails but no big move down and potential triple PD (albeit not quite over 25 mins).

14:10 Wow - all the way down to 10,000. I said yesterday it could hang zag around here for days but never thought this trade would make it. Tempted to jump out but will hold a little longer as no divergence now.

14:12 Huge snap back up but will I get another (or even better) two more moves down?

14:17 First few quick runs down each fall short of the low. Surely they won't let it up without taking out stops below 10,000? NQ reached new lows but DJ, ES and YM failed. Pulling up more now. Perhaps that's it? Move over? Keep losing prices every time it moves.

14:32 TRADE EXIT: Having real problems with data in fast movement so close out right on 10,000 (YM) but before exit signal (although clearly resistance and divergence around this level). +45 for the trade.

Trading on a laptop/dial up combination is not to be recommended but only for a few more days!

14:37 Huge spike back up 10,000 level. Still needs one more push down for classic triple low PD.

15:07 Not a perfect PD but if still in this would have been a strong exit I think in the mid 9990's. Failing that, the inverse H/S after the divergence around 10,007.

Nice strong run up to the end for anyone who reversed on any of these exits (which I didn't).

+24 for the day from 2 trades.
 

Attachments

  • 20040819.jpg
    20040819.jpg
    222.2 KB · Views: 219
Last edited:
Bill

I decided to try the EMA +/-15 system today but quickly realised it wasn't going to work. No system will work 100% of the time, I guess the key is finding how to identify whether you have a workable day or not before you start trading. Not easy!

My view of the action today

A triangle formed from 15:15 (see chart 1 attached) which gave the target of 10010 assuming it broke downwards. I went short and as the price went straight through below 10010 was left wondering what the exit point should be.

Maybe it was a pennant from the opening drop and we were half way through the move in which case the target was 9990 (which was met)???

Seeing the price at 10,000 spooked me as I thought there would be serious resistance at this threshold so I got out for +30. Could have waited and got another 10 points but 30 is good enough for me.

Next a double bottom at 9990 and ND (see chart 2) so went long at 10000 and collected a nice 41 points at the end of day.

Comments and/or criticism welcome as always!

Justyn.
 

Attachments

  • chart.gif
    chart.gif
    42.6 KB · Views: 223
  • chart2.gif
    chart2.gif
    41.5 KB · Views: 202
Trader Tony
Nice to read your thoughts. Is this a log of notes that you make as the day progresses?

Justyn Just a reminder - whenthe price meets T1 target ( wherever that may be) You will usually find either another T1 as confirmation, or you will have the information en route that will give you T2 etc. If there is NO sign of a T2, then start to look for an exit.
I've found that most big moves will always provide a contiguous route from T1, T2, T3 etc to the exit point.Does that help?
 
ChartMan said:
Trader Tony
Nice to read your thoughts. Is this a log of notes that you make as the day progresses?

Yes CM - I make the notes whenever I see anything interesting - they are just a completely unedited real time stream of consciousness!

I have been keeping the log for myself for a while to help with reviews and to keep me disciplined (as well as to help keep me occupied between entries and exits). Often it is just a load of twaddle, but for anyone who is interested I hope it gives an indication of what I'm really thinking, experiencing etc as I go through the day (as well as my actual results, for good or bad).

You can see how my emotions and expectations can go up and down repeatedly in the duration of any trade yet sticking to your basic rules stops me chasing the noise and over trading. This has been particularly helpful during choppy and range bound periods.

Hopefully by posting my thinking and my trades others will feel free to make comments and suggestions which I will benefit from.
 
Justyn & TraderTony

Just to say well done. Nice little earner.

Regards

Bill
 
abbreviations/jargon

Guys - I am new to technical analysis but keen to learn as much as I can as quickly as I can. This thread looks really useful but I am struggling with some of the abbreviations and jargon used, e.g. ND, PD, etc. Can you direct me to where I can find an explanation of what these mean.

Thanks.
 
Hi Alien,

PD and ND stand for Positive and Negative Divergence.

There is a Technical Analysis folder on here, you could have a read through some of the previous posts in there.

A book that several people recommended to me and that I have found useful is Technical Analysis of the Financial Markets by John J Murphy ISBN 0-7352-0066-1

My copy was about £30 from a second hand book dealer on Amazon.

Good luck and happy reading!

Justyn.
 
Justyn,

Thanks. I'm familiar with divergences between price and indicator action so now feel a bit stupid for not realising what PD and ND stood for :eek: I think its just unfamiliarity with the abreviations which seem to be used here very freely. Jargon and abreviations are great when your familiar with them but duanting to a novice. :confused:

I will try and source that book. I wonder if my local lending library service would undertake to find me a copy. They are supposed to offer that service.

Many thanks for such a quick response.
 
Hi Alien,

no worries.

I don't know how easy it is to get that book in the UK. All the second hand copies on Amazon seemed to be offered by USA resellers.

If you are serious about learning TA and trading I would invest in my own copy, an invaluable resource to be able to consult or re-read at any time.

Justyn.
 
Alien - there is an excellent document outlining Chartman's strategy which should make everything much clearer and can be downloaded but I'm afraid I don't have the link - can anyone else provide it?
 
Justyn/TraderDave/fazalv,

Many thanks. I have a lot to learn but there does seem to be a lot of info available. I have found a lot free on the web but no doubt the book goes into greater depth.

I have been spreadbetting the Dow for a couple of years now but overall I am nursing a slight loss which is bigger if I consider what interest I could have made in safe cash investments. Generally I use trends and Fib points to determine entry and exit points. Sometimes its complete intraday but often I let it run for up to a week with wide stops. After a few recent bad moves I am now finding it difficult to pull the trigger. I realise that I need to develop a soundly based system both for placing trades (bets) and money management to increase my confidence again.

I have discovered that running bets overnight and weekends is a great slimming aid as it almost totally destroys my appetite. Not good for sleep patterns though.
 
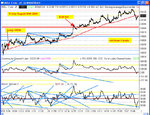
Friday 20th August 2004

All markets gap down although less than yesterday.

9:36 Gaps closed on ES, YM and Indu - now back above 100 ema

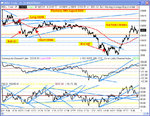
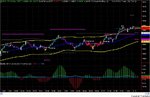
9:46 TRADE ENTRY: Long at 10036 (10038 YM) on move back up off 100 ema but risky as still no clear direction or taking out of yesterday's late swing highs and lows. Moves up but needs to take out 10050 level with conviction now. And it fails to do so on first attempt, then peeps over but cannot get away and heads straight down again. Going for a hat-trick of losing first trades today so really nervous about this one.

10:05 Has another run up and takes out HOD but only by 1 tick with possible ND (could count as three peak ND if you go back to yesterday - not sure how to treat this). Drops swiftly. One more run up stopped dead at 10050 and down it comes. And again. I just don't know if I should still be in this or not. All the way down to entry and 100 ema and another bounce which goes to HOD again and stalls, then breaks out as ES takes out yesterday's HOD.

Question: Was the triple peak ND at 10:10 a good exit, taking one of its peaks from yesterday? If so, it would have been best to exit here for +14 or so and re-enter on the 100 ema bounce.

10:35 Strong move up to new highs but then reverses very quickly. Next significant recent high is 10083 so a bull flag here would be good with a T1 on the next move up of that recent high. But the flag isn't holding and the retracement just keeps coming down. This is horrible price action for the long position. And price back to 10050 level. What a magnet. Really need it to bounce soon now as it has given back more than two thirds of its peak profit.

11:04 All the way back to 100 ema - and drops below - and trade virtually back at entry. That's a shocker - it has just dropped all the way back down on a single move up. From 30+ in profit. I've no idea what could have given an exit as it looked perfectly poised to keep on up or at least have a try at going higher. Ugly.

11:20 Starts another run up. Gets above 100 ema and 10050 level but I suspect this will be a nightmare lower high/right shoulder formation. Stalls around 10055 then pushes up to 10060. It must run to the HOD at 10068 now. No, it has failed the second move up and is coming back down. Looks like a head and shoulders. Back at 10050 (!!) and through to the downside. Right at the 100 ema again.

11:47 Triangle breaks to the downside, below 100 ema. Long looks completely doomed now. And into loss. But bounces back up - fake out or return move? Pauses for thought then continues up to resistance on top of triangle where it stops again (but back above 100 ema/10050 levels). Looks like this will knock it down again. Jumping all over the place. But fails to break out. And then back down below 100 ema and then back up above! Jeez. This is a tough tough ride. Stops again at 10050 and just cannot break this upper resistance line. Objectively I would expect the move up to the recent highs at some stage today but right now it's just not happening for the longs.

12:06 OK - here it break up but this time it looks like a fake to the upside (although there was some real volume on the breakout). Nope, straight back down again (to 10050). Then it does break up convincingly. Again, T1 looks to be at the recent high (10083).

12:15 Stalls at HOD. Let's see if we can get a flag this time, again predicting at move to mid 10080's. But no, it's dropping away quickly again. Then stabilises. Flag forms but it appears to break to the downside. Maybe HOD will hold and push it all the way down again. The fact that we are moving into Friday lunchtime could upset the long applecart as a big move is probably less likely and another pullback thus favoured. Unless it goes quickly, hits the recent high then they pack up shop for the weekend.

12:42 Breaks out of flag but no upside follow through.

12:51 Breaks to upside but stalls at HOD. Then moves on up.

12:55 Right, it's Friday evening, I'm on holiday and I'm closing at my T1 for +44 which gives me a very satisfactory +100 points for what often felt like a really tough week. Hopefully I closed too soon (i.e. no divergence exit yet), but today's not a day for me to be greedy.

Will post chart after close.
 

Attachments

  • 20040820.jpg
    20040820.jpg
    213.6 KB · Views: 206
Last edited:
An end of week thought...

Over the past few weeks trading the Chartman strategy I have taken far fewer trades than I would normally do and I have often held them for longer periods. I still have much to learn but my experiences so far have given me a new insight into the market.

Basically, because I am not reacting to every twist and tun of the market (although for those who read my notes you will know that I experience them all emotionally) I have concluded that if the market is going to go up (as in today), the market makers will often do all they can to sucker you into thinking it is going to break down, over and over, before finally taking it up. Conversely, when it is going down, they will often fake many upside moves to get you long before they drop it. The exception is perhaps when they move it so quickly you have little time to react and get left behind.

A strong upside move always seemed likely today from an objective assessment, and CM's strategy would only have allowed you to be long (price always above the 100 ema -20), but anyone not following this could have found many many short term reasons to be looking for shorts.

Anyway, looks like I left plenty on the table (which can be a problem with me when I'm in profit) but I've no regrets tonight and I'm off get the kids in bed and crack open a chilled bottle of something nice.

Good weekend to all.
 
tradestation TY tick chart

my scalping set up
 

Attachments

  • YM.jpg
    YM.jpg
    119.3 KB · Views: 256
Top