Dow Intraday Charts 16 Aug - 20 Aug

FetteredChinos said:
ok, your buy signal on the DOW. where are your exits then? just curious as, i still reckon short is the way forward..

thanks for the offer re:trade signals, but no thanks. the only bar i watch full time is my local....

fetterchinos If you only watch your local tavern dont sabotage the trading efforts of new folk who venture in here and get the impression you know what you are doing,

I told you it was not going short and youd get hurt..
 
Hi guys .... here is my take on what happened today (could be right or wrong, comments welcome)

From the open the price rose 75 points from 9935 to 10015. I saw the pennant marked in the chart attached. (The chart is a 3 min one as 1 min wouldn't show the data up to 9pm)

A pennant is nornally a continuation sign (although not always) so when it broke at 9995 it gave a target of 10075. But this was the start of lunchtime so the price pottered around for 2 hours before finally heading for the target.

Is this correct? Or is it luck that I saw a target of 10075 and we actually ended up there?

Made a few points so I'm happy.

Justyn.
 

Attachments

  • chart.gif
    chart.gif
    25.6 KB · Views: 250
Last edited:
Dear GULLY,

If you email me directly I will show you the secret and each UK evening I can tell you exactly where to expect 4 buy and or 5 sell trades,all with $50 risk..we watch every bar full time so we exit ourselves ,part of the discipline training and also to stop folk hoping and wishing.

I can't contact you directly, you have the private message feature on here turned off. I would be interested in learning more.

Regards,

Justyn.
 
Last edited:
Wednesday 18th August 2004

9:51 Price pulls up from 30 odd point gap down on opening (low at 9934) to hit 100 ema at about 9963.

9:56 TRADE ENTRY: Short at 9958 (9956 YM) on pullback down from 100 ema with support TLB on RSI and CCI. Feels risky as gap not closed yet on any indices.

10:03 Gaps close on ES and NQ but trade now well into loss and price well above 100 ema. Going to be a very quick loser.

10:11 TRADE EXIT: Stopped out -28 on YM. How not to start the day.

10:34 Sharp drop back to 100 ema

10:36 TRADE ENTRY: Long at 9974 (9978 YM) on move back up off retracement to 100 ema. No follow through and soon nursing losses on this one too.

11:06 After hitting +35 or so it drops all the way back to the 100 ema (and virtually back to entry level). Obviously unable to hold the 10,000 level. Very frustrating.

11:18 Pushed up off 100 ema to 10,000 level but unable to take it out and soon falls sharply again to 100 ema. Big H/S forming on price now.

11:33 Back up to 10,000 once more off 100 ema but just stopped dead. Really needs a strong push up here.

11:37 Nope, it's coming down again. Fun and games at the 10,000 level.

11:53 Triangle breaks to the downside and price drops through 100 ema but not obvious volume pick up on futures. If it's not a fake out this trade is screwed.

12:00 Well, it went up again to 10,000 but, inevitably, it stopped the move dead for the third time. We could zag around here for days now.

12:05 And down it drops again. This is infuriating. Then straight back up for a fourth attempt which fails again. ES and NQ not up with it this time. Then they follow it up to the top of their channels. This could be it. No. Fails for fifth time and drops away.

12:23 Finally pushes above 10,000 but no volume or significant run up.

12:53 Breaks down below 10,000.

13:00 Dropping like a stone.

13:33 Pulled back up to 100 ema from below. Final chance for longs to get back in charge? Tried to push through, stalled, then made it to the upside. Soon comes to rest back at the 10,000 level.

13:56 Failed to take out HOD and falls back through 10,000.

14:01 Bounces back up off 10,000/100 ema to new highs for day and also takes out yesterday's high.

14:16 TRADE EXIT: Close on triple peak ND at 10036 for +56 on YM.

In view of the footie this evening (!!) I will call it quits there at +28 from 2 trades.

Looks like there was a good re-entry just after 3pm with a pullback off the 100ma and PD on the RSI for a ride up to the close, but not sure I would have taken it in the heat of battle.
 

Attachments

  • 20040818.jpg
    20040818.jpg
    236.1 KB · Views: 239
Sun headline:

Dow trader jumps from office window after big big boob!!!

See page 3 for further details.​

It was reported today that the CEO of T2W Independent Traders [T2WIT] after enormous losses during trading the daily Dow cash lost the equivalent of the GNP of a small African country and rather than face his critics on the T2W BB decided to end it all. Unfortunately it transpired that the luckless individual lives in a bungalow so injuries were restricted to a torn jumper and two, no less, broken fingernails. An informed source tonight revealed that said individual is undergoing intensive therapy under the strict supervision of the manager of a nearby public house. Latest reports are that his sitaution can be described as satisfactory although he appears to have lost the use of his legs.
 
Bill,

I told you 3 days ago what would happen today:

Tuesday turns out to be a sideways day closing very near the opening price so we expect Wednesday to have more movement like Monday.

Today started as a trending day with 80 points up after the opening gap. On days like these you need to forget the EMA +/-15 strategy!

I might be trying your strategy out tomorrow morning though ;-)

Justyn.
 
Nice move up, settling at channel top.Could be a tad more in it, but getting close to OB.
 

Attachments

  • dow 18-08-04 10.gif
    dow 18-08-04 10.gif
    39.8 KB · Views: 266
Bill:
Said trader may have lost the will to live....but @ least he has not lost his sense of humour, so methinks he will survive! :)
 
It is a RED LETTER day today for me and I get my Blue Peter Badge. This will be my 5,000th post...... and a very appropriate day for it to happen with a nice little upper on the charts to go with it. :cheesy:
I was long overnight as I was out all day so did really well,but I closed most at 10,040 on the ND and left the rest in..... which might be a mistake.
As for 34 ma ona 5 min, thats 170 on a 1 min.Seems not so useful as 100EMA....
I'd like to thank all those that have followed my posts, and hope that those of you that have benefited,continue to do so. And for those that haven't , I hope you find your Holy Grail somewhere.
 

Attachments

  • dow 18-08-04 1.gif
    dow 18-08-04 1.gif
    26.6 KB · Views: 220
Many Many Congratulations Chartman!!!
As a short time lurker with little TA knowledge, I dont contribute to this thread (thank gawd i hear u say)!, however I read and enjoy and try to pick up knowledge from it. 5,000 Thank you's, your efforts are much appreciated :)
 
*HAPPY 5K CM*.............!!!!!!


A great guy with great charts.......... :cheesy:
 

Attachments

  • fireworks1.jpg
    fireworks1.jpg
    200.8 KB · Views: 188
  • fireworks2.jpg
    fireworks2.jpg
    65.5 KB · Views: 234
  • fireworks.jpg
    fireworks.jpg
    21.8 KB · Views: 545
OK This is what happened.

I'm glad that we have seen today what really happens in a trending market but the downside is not as bleak as you might imagine. Bear with me I have quite a lot to say although I did not even simulate a trade today.

A Shows nd but none of the rules are met so no trade.

B Short Rule 1. SL rolled to BE when 100ema reached

C Stop for 0 points. This is also another entry rule 1. Stop brought to BE when price reaches 100ema line. Stopped out for 0 points.

D Is the only potentially long for the day but was not close enough to the -15 line to warrant an entry under these rules.

E Short rule 1. Stop brought to BE when price reaches the ema line. Stopped out for 0 points.

Note there is no loss thus far.

F Short rule 1. I would have hoped to in get 10020 here but it's a bit academic. Lets say a 25 point loss.

G There was nd here [sorry, if you draw the line a little different it will be > 25mins] But rule 3 is not met as nd is too far away from +15 ema, so no short.

H This is not an entry but notice how the price tracks the ema+15 line. I feel this is significant; but how to convert it into cash? That's another matter.

There are no more entries.

Comment

I have absolutely no doubt that there are people who bought at the open and sold at the close with a big big smile on their face [and loss of the use of their legs for a different reason].
But what I expected was that this approach would absolutely slaughter me in a trending market. Today I think I would have lost 25 points which is not the end of the world. [Don't believe all you read in the Sun]

The only regret is that I was not able to do the simulation today to verify that.

Furthermore this is a very blinkered approach and I feel that if I could adapt the rules to perhaps buy at a 100ema touch in a trending market then the story would be a whole lot different. Or possibly simply dump the rules, as Justyn suggested, and apply the normal Dow rules. It all comes back to the same question. How and when do you decide that it is a trending day or a sideways day? Perhaps market internals as Hampy said on Monday. Or is there a clue on ES volume as CM so often says. Needs further work doesn't it.....

Hope you find the posts entertaining

Regards

Bill

PS 5000 post is no mean feat CM, very well done, I'm sure everyone appreciates it as much as I do.


Rules are

1. Short if price crosses 100ema and touches/crosses 100ema+15
2. Long if price crosses 100ema and touches ema-15.
3. Short if nd and/or price is 100ema +15 [or v close]
4. Long if pd and/or price is 100ema -15 [or v close]
5. Don't trade in the 1st hour
6. Stop losses above/below obvious SR
 

Attachments

  • Dow_180804.gif
    Dow_180804.gif
    43.2 KB · Views: 218
Many Congrats ChartMan - I for one continue to benefit from your posting and excellent analysis - keep up the stirling work!

Bill, and others who are interested
Please don't think that the following post in any way reflects my personal trading standards, as I have a long way to go in that department, but these observations and notes from others/other sites MAY just help in some way. If only I could see/follow them myself ! :rolleyes:
Statistically there will be on average around 4/5 trend days in any one month. These have a higher probability of occuring on a Wednesday, and secondly on a Thursday, Monday is the least likely day. One of the pieces of data that I record on a daily basis is Trading Range of the day. Statistically a trend day is more likely to occur on the day following the day which has shown the narrowest range for the past seven days. This is known as NR7. The range for YM up until yesterday reads like this: 50,106,113,120,72,149,70.

So it wasn't quite an NR7 day, but it was pretty damn close AND it was a Wednesday.

What I am doing now people is banging my head against the desk, as I quite clearly should have noted all this in my pre-market preparation, and used it in my trading for the day. And do you think I did? :LOL:
Anyway I present this as information only, in an effort to help others who may be able to use the snippets better than I can!

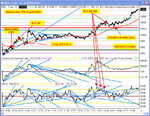
Bill, I'm not much of a moving average man, but it struck me from looking at your chart that maybe you could look into the possibility of using another average as a guide to marking the likelihood of a trend day. Say, the +/- 25 line, as it appears that price has moved away further, but still returned and then shot away in the direction of the trend. So on a trend day the trades are not counter trend, but with the trend and taken on the pullbacks to the 100ema. It may be worth looking back over a number of months, and seeing if there is some sort of pattern that occurs on days like these.

Just some of my thoughts anyway.
Cheers
Q
 
Thanks for the message Quercus, your posts are always constructive and helpful.
I'm fairly happy with the performace on a sideways day and now need to tackle the rules for a trend day as I describe in the last post. It would be useful if the next couple of days turned out to be strongly trending to hopefully provide more data. The back testing idea is good but, assuming there is still sufficient interest in this experiment, I will try to provide a summary of ideas an a summary of this weeks experiment sometime over the weekend.

Regards

Bill :)
 
I'm sure if you persevere, something will come to light to resolve the trend day issue. Otherwise it looks very worthwhile. In any case, nothing works all the time for anyone. It just has to be better than average.
 
Gully said:
fetterchinos If you only watch your local tavern dont sabotage the trading efforts of new folk who venture in here and get the impression you know what you are doing,

I told you it was not going short and youd get hurt..


one swallow doesnt make a summer..

neither in my case nor in yours.


Chartman,

well done on your sterling efforts thus far. it is much appreciated by everyone.

good to see some people got the fireworks out too.


FC
 
well done on your sterling efforts thus far. it is much appreciated by everyone.

And I second that!

Thanks for all your continued help and advice Chartman, as a newbie you have given me loads of help.

Justyn.
 
I would just like to add a thankyou to Chartman for the excellent work he does on this site.
 
Chartman, I am honoured to congratulate you on your 5000th post.

BIG thank you for all your hard work, your posts have inspired many and the daily updates have been truly invaluable.

Thank you.
 
Top