You are using an out of date browser. It may not display this or other websites correctly.
You should upgrade or use an alternative browser.
You should upgrade or use an alternative browser.
FetteredChinos
Veteren member
- Messages
- 3,897
- Likes
- 40
if you are now short...... 🙂
tradesmart
Experienced member
- Messages
- 1,286
- Likes
- 22
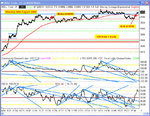
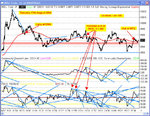
This certainly looks like a technical bounce to me motivated by ‘oversold’ conditions and a slight dip in the price of the black stuff (now bouncing back to $46.20/b as I type…….!) also in the face of dismal NY factory data……!?
Pronounced PD on the charts at the end of last week and the mysterious late bounce Friday might have given us the clue, and an obvious ‘W’ bottom might well propel us up to the top line of the expanding range just north of 10100 if the ‘W’ target is met (I did say “if”…. 😉 )
but not today imho…….
Pronounced PD on the charts at the end of last week and the mysterious late bounce Friday might have given us the clue, and an obvious ‘W’ bottom might well propel us up to the top line of the expanding range just north of 10100 if the ‘W’ target is met (I did say “if”…. 😉 )
but not today imho…….
Attachments
TraderTony
Active member
- Messages
- 180
- Likes
- 1
Monday 16th August 2004
9:40 Gap up with first pullback right off 9832 but I left alone as I was reluctant to enter 20+ points away from the 100 ema so early in the day but it just flew up over 40 points in 6 minutes without a pause even for breath.
10:14 Hits 9920 at T1 from consolidation area (still on sidelines though).
10:27 Triple ND exit at 9932 - 100 points up from the early pullback (but still no trade and anxious now about entry after such a big move and an exit signal).
It keeps on going up and up, always 40 points or more above the 100 ema, without any obvious low risk entry.
11:47 TRADE ENTRY: Finally go long at 9936 following consolidation with support around 9932 (closest to 100 ema of the day so far). Still feels very risky as price needs to break big resistance at 9950 to carry on upwards and there have been a series of NDs on the upwards peaks
11:59 trade already breaking down into loss but still above the 100 ema and in a bull flag formation
12:03 Hits 100ema and looking weak - currently -12 and falling.
12:22 Move back up after running sideways along the 100 ema with TLB on CCI and RSI but using a lot of RSI for a small move in price.
13:19 After an hour or more going sideways along the 100 ema it popped back to resistance/HOD at 9949 but could not break through and fell back quickly. Potential double top in place now as it retraces straight back to 100 ema with CCI moving below zero for first time in the day.
14:05 Finally breaks up through 9950 - will it hold or just be a fake out?
15:08 For an hour it has crawled sideways sitting on 9950 without any move up. Thinking about cashing in a small profit and calling it quits. And as I type it breaks right down and after holding for over three hours I'm back at entry.
15:58 TRADE EXIT: Push back up at close and I got out with 5 mins to go at 9956 for +20.
RESULTS FOR DAY: +20 from 1 trade
As ever, comments and suggestions much appreciated.
Attachments
Bill
Active member
- Messages
- 160
- Likes
- 1
Hi
Fully expected to be posting a negative result today given that there was a massive rise in the Dow, expertly predicted by Justyn. Next time I'm gonna listen to you!
These were traded on Capital Spreads simulator
First hour ignored. Rule 5. Well done to anyone who took a long and it's your round btw
A Short @ 9942 rule 1. SL was 9964 but brought to BE when price reached 9932.
SL taken for nil poin
B Short @ 9946 rule 3. I could easily have got 50. Panicked.
C Close @ 9937 +9 rule 2.
I don't like it for a trending day like this. Maybe some modifications are in order. The danger is in taking lots of short when the market is decidedly positive. I would not risk real money on it.
It did keep me out of the market during first hours as none of the rules were met. In rule 3 nd needs to be close to 100ema +15 to apply.
Rules are
1. Short if price crosses 100ema and touches/crosses 100ema+15
2. Long if price crosses 100ema and touches ema-15.
3. Short if nd and/or price is 100ema +15 [or v close]
4. Long if pd and/or price is 100ema -15 [or v close]
5. Don't trade in the 1st hour
6. Stop losses above/below obvious SR
Now what did he say? Sideways on tuesday................hmm!
Regards
Bill
PS If my charts lok a bit fuzzy it's because they are a screen dump of my Excel screen. You should get the gyst though.
Attachments
I reckon it may be worth looking at the old ES threads for China White's definitions of trend days, this could then be used in conjunction with Bill's ideas.
1 rule I do remember: On trend days trade in the direction of the trend entering on pullbacks towards the 100 ema. I have the rest printed off somewhere, I'll look it out and post in the next few days.
Cheers, hampy
1 rule I do remember: On trend days trade in the direction of the trend entering on pullbacks towards the 100 ema. I have the rest printed off somewhere, I'll look it out and post in the next few days.
Cheers, hampy
Good day for going long... But where to jump on.? Confusing signals on RSI at OS levels makes you stay out because it must fall.... which it didn't. I had hoped the bull flag would bounce off 9932 and away to 50 + , but it didn't. I guess the brave among you that took the pullback at 9832 as a "dead cert" entry, would have laughed to the bank all day long, whilst other would just wonder when they would find an entry..... which was nigh on impossible. That is , until the end, with the PD across 9932 for a long....
The "W" on the 10 min chart has a target of 10,100.To get there, we need to break 9950 convincingly.......
The "W" on the 10 min chart has a target of 10,100.To get there, we need to break 9950 convincingly.......
Attachments
Hi Bill,
I can't believe you didn't take my tip about the 100 point rise in the morning. Next time a complete stranger offers you such a good tip you should act on it without hesitation 😆
Hey, you made 9 points on the day (same as me as it happens) and could have bagged another 50 if you had stuck to your rules and not panicked. It could be you have the basis of a good system here that suits your trading style and that you can tweak and adapt as you go along?
I tried for ages to draw EMA +/- 15 lines today in Esignal but couldn't figure it out. I tried using an offset but this offsets the time not the price .... any ideas anyone?
Justyn.
I can't believe you didn't take my tip about the 100 point rise in the morning. Next time a complete stranger offers you such a good tip you should act on it without hesitation 😆
Short @ 9946 rule 3. I could easily have got 50. Panicked.
Hey, you made 9 points on the day (same as me as it happens) and could have bagged another 50 if you had stuck to your rules and not panicked. It could be you have the basis of a good system here that suits your trading style and that you can tweak and adapt as you go along?
I tried for ages to draw EMA +/- 15 lines today in Esignal but couldn't figure it out. I tried using an offset but this offsets the time not the price .... any ideas anyone?
Justyn.
TraderTony
Active member
- Messages
- 180
- Likes
- 1
Tuesday 17th August 2004
Forgive me, but this one goes on a bit....
9:35 Market moved straight up off opening from just above 100 ema but too quick for me. ES/YM/NQ all gapped up (after late drop yesterday) and kept on up. So, like yesterday, I am kicking myself on the sidelines with prices now way above the 100 ema and a 40+ point move missed out on.
9:55 Forms new peak HOD at 10024 (up 70 from yesterday's close) with ND from earlier high at 9:37. Could therefore give third peak for triple ND at 10:13. Still on sidelines.
10:13 No third peak on schedule - sideways move followed by decline (kind of head and shoulders after ND between left shoulder and head) so perhaps a chance now for a pullback to 100 ema for long entry.
10:33 TRADE ENTRY Long 9984 (9980 YM) on bounce off 100 ema with TLB on price and RSI with CCI bounce from near zero line.
10:37 Although trade moved immediately into profit there is no obvious follow through to the upside and it is using up a lot of RSI which is not a healthy sign. Could be turning into bear flag.
10:49 Resistance TL on CCI knocks it down again after slow and unconvincing move up off 100 ema.
10:55 Falls through 100 ema and into loss. I'm not liking this at all now.Price desperately needs a sharp push to the upside to get this trade back on track.
11:00 Price taking out swing lows on cash, YM and ES. This trade is going down the pan.
11:16 100 ema has now turned to resistance with trade in dire straits albeit not yet stopped out - looks to be only a matter of time though.
11:20 New swing lows on NQ and ES. Make or break time for the downside.
11:37 Went right to 20 points below 100 ema but I let it run (within my hard stop of -35) because of apparent triple low PD forming. This did give it a kick back up but no threat to 100 ema so short definitely looks like the place to be.
11:46 Back at 100 ema from downside. Pulls back down a little before retesting and failing. Also at major resistance line on both price and RSI from HOD. Damn - breaking back down. Looks like it's curtains this time.
12:01 Ok - last move down failed to make new low and last swing high has just been taken out to upside so possible change in trend. However, it still cannot get above the 100 ema so probably just a bear flag for more movement down.
12:15 Big bear flag developing right at the 100 ema. A break down here will not only kill my long but also represent a very healthy looking short entry.
12:32 Triangle/bear flag breaks to the downside.
12:47 Break down did not follow through and instead we get a bit more movement to the upside and above the 100 ema for first time in a long while. No real buying volume apparent though.
13:04 Went about 15 points above 100 ema (taking trade back to entry point) before first pullback. Desperately needs a higher high on next move to confirm real change back to uptrend.
13:11 Instead it breaks down to form a head and shoulders.
13:12 H/S breaks to the downside and price back below 100 ema.
13:30 back up to form possible double top at 9888 and smashed down to take out swing lows. There was a kind of triple ND on RSI as an exit for about -8 points but I missed it. Arghh.
13:42 Lose data feed. Great. Market chopping all over the place at the moment but only coming through in dribs and drabs. Very frustrating. I've absolutely no idea what's going on or what the real prices are.
14:12 By the time I got data back I was -30 and the low probably could have taken me out at -35 but I was still in and price had not broken more than 20 below the ema suggesting the downside has now real power and may run out of steam soon.
14:34 Price pulled all the way back up above the 10 ema again but stopped short of earlier high at 9988.
What a crazy, frustrating day - within 20 points of 100 ema for over four and a half hours so far.
14:44 up to higher high but still not taken out 9988 and spiked straight back down again. Then just jigging about without taken out this key upside resistance level. Then it breaks back down again. This is driving me mad. Back below the 100 ema and the CCI zero line. I think the market makers are just jerking everyone around today.
15:54 TRADE EXIT: Finally closed just before end of day at 9972 (9964 on YM) for -16.
What a mess of a day. Again, the only consolation for me is that in the past I could have been whipped to death in these conditions. One day I'll learn how to scalp them. I bet Bill had a blinder today.
-16 from 1 trade
Attachments
Bill
Active member
- Messages
- 160
- Likes
- 1
Plus thirteen and dreams of what might have been.....
A Long Rule 2
B Long Rule 4
C Short Rule 3
D Long Rule 2
E Long Rule 2
In simulated trade.
I don't get home from work until after 5 so missed A & B
Missed C ....Nodded off
At D Long from 9963. ND exit was too short but had moved my SL to BE so stopped out for 0 points
Long at E from 9956 closed at 9969 +13 points
Still think there was more to be had especially as Justyn said it would be sideways today. This time next year we'll be millionaire Justyn. Trade2win's Independent Traders?
Mus' get da van fixed
Bill 😉
Rules are
1. Short if price crosses 100ema and touches/crosses 100ema+15
2. Long if price crosses 100ema and touches ema-15.
3. Short if nd and/or price is 100ema +15 [or v close]
4. Long if pd and/or price is 100ema -15 [or v close]
5. Don't trade in the 1st hour
6. Stop losses above/below obvious SR
Attachments
Last edited:
Hi Bill,
I was thinking about your system today as the price criss-crossed the EMA and was wondering how you were getting on!
I still can't figure out how to draw a line 15 points above and 15 points below the EMA - can you give me a clue?
I chanced a long before the open today, then about 10 mins into trading my Esignal package died on me so I was blind and had to exit. Made a profit but by the time I had sorted Esignal out we were into lunchtime (sideways mode) so gave up and did something else instead.
Anyway, bring the van around early tomorrow Bill, I have a shipment of shop soiled Bulgarian DVD players for us to knock out down the Peckham market.
Justyn.