Dow Intraday charts 14/07 18/07

ChartMan

Legendary member
Messages
5,580
Likes
47
Good start. I remember a day like this last week :)
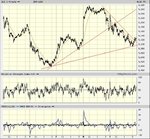
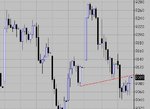
Double ND top and out, then go home. The following bull flag failed very quickly and set the tone for the rest of the day. Were it not for the glitch at the end ( another trader BIG error??) we'd have closed at the Inv H&S target that someone suggested on Friday.
More upside tomorrow even though it doesn't look too promising on the face of it.
 

Attachments

  • dow 14-07-03 1 mina.gif
    dow 14-07-03 1 mina.gif
    21.5 KB · Views: 686
Hi Chartman,

Not being too technical, I thought the break below the 9240 area was interesting. Was there any significance in this move? Although you say it had already failed, would you still have been short on the later drop?

Cheers
 
Yes 9240 was a solid intraday support and a short below that. Staying in for the pullback is a matter of whether your position size is correct for your strategy. The two large up bars may have frightened some, and there was a second chance out at the small pullback at 9210. Tough call......
 
I have recently setup an account with IB with the intention of trading the Dow Jones using the strategy explained in the doc.

Can someone please tell me the IB symbol code fro trading this.
 
Hi Blash

The code is YM and the exchange is ACE its the futures contract and not the cash index .
Regards mark
 
Blash,
You can also take a look at the ticker DIA. It is an AMEX ETF that tracks the dow jones. It tracks pretty close, although you can see differences - but then CM uses a spreadbet, which isn't any closer. Because it is an equity, you don't need trading permission to trade futures.
Steve


Steve
 
All the charts posted by Chartman are for the DJIA.
This is probably the most stupid question this year, but surely you ppl who are trading this system are trading from realtime futures charts and not the DJIA chart.
 
We chart DJIA for trend/support/res etc and use S&P 500 futures for volume. DJIA futures chart is not of much use. Far too spikey.With these two you can trade DJIA, DIA S&P futs etc. One compliments the other.
 
More upside eh? Well it did for a minute! I never said how long for.... I made my score in ES premarket.... If you got on the bear side, staying in all day was easy... If you tried to be a bull, I guess it wasn't your day. The early RS switch failed to deliver, CCI being unable to break above the zero line. The second one did the business...eventually. A long haul to make 80 - 100 points, today being a scalper's day.
 

Attachments

  • dow 15-07-03 1 mina.gif
    dow 15-07-03 1 mina.gif
    20.5 KB · Views: 560
Dow 16/7/03

Chartman,

Dow broke the down trend, Resistance support switch can be clearly seen just before end of day.
Expecting bullish start, support line (9080 for today) will play a crucial role in today's events.
 

Attachments

  • dow.jpg
    dow.jpg
    104 KB · Views: 597
Last edited:
Plenty of options here to go sideways, up or down a bit more to 9K...... The general trend is clearly sideways. The "W" bottom may deliver to 9150 and then 9250 tops.
 

Attachments

  • dow 16-07-03 10 mina.gif
    dow 16-07-03 10 mina.gif
    30.1 KB · Views: 518
Strange day.... After the initial drop of 100 odd points, there was little other action, but keeping an eye on the divergences should have prevented any major disasters. Closing as strong as it did,should give us some more upside tomorrow.
The SR SWitch worked well, and following on, you should have seenthe short exit as the triangle in RSI broke to the upside at 19:33....
 

Attachments

  • dow 16-07-03 1 mina.gif
    dow 16-07-03 1 mina.gif
    20.9 KB · Views: 519
CM, I've noticed this on the Dow this morning. Your thoughts?

I know you calculate your H&S different from me, but using the "traditional" calc, this offers about 8900 as a target ... :(
 

Attachments

  • dowh&s.jpg
    dowh&s.jpg
    34.3 KB · Views: 463
Using my method, DOW has failed to penetrate the target around 9030, although pre market has dropped below this...
 
Just a quick report tonight.... not that there's much to talk about, sideways being the order of the day, based around 9050 pivot line.For the brave, a swift long and short at the open would have netted 150 odd points in a half an hour.......
 

Attachments

  • dow 17-07-03 1 mina.gif
    dow 17-07-03 1 mina.gif
    20.6 KB · Views: 452
What a boring day. Still, those that have patience and trade the 100MA would have made a solid 100 points today.It took a long time, but then patience is a virtue sometimes.
NB the drop in RSI from 90 to 18 and the price went up 20 points!!! work that one out. Mind you, the triangle break that followed was sweet. :) Nice n eaasy 60 points.
 

Attachments

  • dow 18-07-03 1 mina.gif
    dow 18-07-03 1 mina.gif
    20.2 KB · Views: 311
Hi Guys and Girls

Am i correct in saying the price has now gone through resistance and if its gets through the 9190 barrier on Monday it should go straight up with little pressure looking for a 100 pointer plus i have tried to attach a chart several times will no success , look forward to others views . have a good weekend all .
Regards mark
 
It depends on your timescale.... Yes it has on the 1 min chart at around 9100 and or 9150. No it hasn't on the 10 min chart.That's at 9250.Should this triangle break to the upside, the target is 9600.Timescale 3 weeks or so.
 

Attachments

  • dow 18-07-03 10 mina.gif
    dow 18-07-03 10 mina.gif
    30.5 KB · Views: 285
Hi chartman

Sorry should have said i was using a 10 minute time frame and only trying to work out mondays direction i just tried again to post a chart with no luck the chart is bmp and only about 5 inches square could you tell me if there is something missing as i followed the intsructions .cheers mark
 
Top