You are using an out of date browser. It may not display this or other websites correctly.
You should upgrade or use an alternative browser.
You should upgrade or use an alternative browser.
tradesmart
Experienced member
- Messages
- 1,286
- Likes
- 22
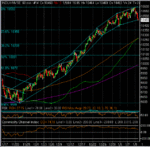
I’m still watching apparent ‘slope’ changes on the 60min chart for clues – the 140 ish point tank on 2/1/04 gives a nice parallel channel when linked up with last Fridays’ 140 point tank (a neat coincidence!?)
The futures are currently indicating a mild bounce; maybe investors will view last Fridays’ tank as a chance to get in 'cheap' before some good earnings numbers this week….
But the people promising good earnings numbers are the same ones who were promising good NFP numbers on Friday – and they were 120,000 out……!! 😆
(apparently, the growing US economy is creating plenty of jobs in India and China 😉 )
Attachments
tradesmart
Experienced member
- Messages
- 1,286
- Likes
- 22
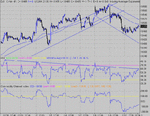
Long from 10453 - double-bottom with PD - hoping for 10500+
tradesmart
Experienced member
- Messages
- 1,286
- Likes
- 22
Well, the almost inevitable tight 'consolidation' day after Friday's big move......... 🙄
closed long at 10480, when the 3rd attempt to breakthrough this level failed....
this evening's direction will depend on a break of the 10480/10450 range imho......
closed long at 10480, when the 3rd attempt to breakthrough this level failed....
this evening's direction will depend on a break of the 10480/10450 range imho......
One Eyed Shark
Well-known member
- Messages
- 257
- Likes
- 13
Shame we didn't see the break of 480 a little earlier which could of given us a bit of a rally to the close.
IMHO looks like we could have a +'ive day tuesday. 😀
So far 2004 has seen a lot of sitting on the hands to keep me out of trouble, some of the range bound days have been a nightmare to sit and watch.
Please can somebody come up with some way of spotting these days in advance, the sooner the better :cheesy:
tradesmart
Experienced member
- Messages
- 1,286
- Likes
- 22
CM - took the plunge again long at the PD bottom at [email protected] ish, and just closed at 10502.......
I'll probably regret not holding overnight - this has got 10564 written all over it........... :cheesy: 😉
ps OES - most times after a big move day as last Friday, it's going to consolidate in a tight range whilst deciding what comes next - in this case as you say, very likely more up....it's the prospect of those good earnings reports that are keeping it on the boil imho...
pps I thought that you were making a fortune out of these rangebound days anyway!! 😀
Last edited:
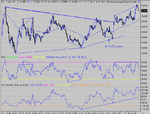
I'll take a guess at the down channel lines. If nothing else,I'll know where up us, and where more down is. Has RSI risen too much for a consolidation? It's sitting at resistance.Not a lot of room left for the upside, unless it's a substantial move....Plenty of room to move to the downside, but I favour TS's reasoning and direction.Nonetheless, TWYS.
Attachments
tradesmart
Experienced member
- Messages
- 1,286
- Likes
- 22
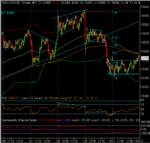
The bears must have thought they were in with a good chance at the beginning of yesterday’s session, but stronger forces prevailed (for now!)
A zoomed in view of the 10min chart tells the story of recent days action – the head and shoulders that led into Fridays big fall, and the apparent rolling (saucer?) reversal shape of yesterdays action, that suggests a further attempt at upside today….
Plainly there is likely to be a solid wedge of resistance at 10520 ish (also 50% fib) to overcome before any serious progress can be made (if it gets that far! 😕 )
Attachments
CM, What do mean with
Thanks
Look for an ND at 15:27...else take care with short.
Thanks
I took the two major peaks at 507 and 510 which had 27 mins time separation. That is where I would look for the 3rd peak... As for a short, today's open continued on from yesterday, making a short a risk entry near the open.
Following 10MMA bounce here...ES vol divergence too.
Following 10MMA bounce here...ES vol divergence too.
Similar threads
- Replies
- 74
- Views
- 13K
- Replies
- 0
- Views
- 2K
- Replies
- 10
- Views
- 6K


