Dow Intraday Charts 07 Sept - 10 Sept

Thanks for the comments TS - I actually use a spread betting account for longer term positions and this seems to work well. I'm not panicking yet as I've done very very well since adopting CM's approach a couple of months ago (even though I'm still a relative beginner with this methodology). Four 60 point ranges in the first 6 days of September is tough going for a trend trader (and one of the other two days was dominated by that nasty spike on the gas leak/terrorism scare). As I said above, in the past these kind of days have caused me real grief so -20 for the month so far is actually a major achievement for me.

Hannonjm - I use the Mini Dow (YM) for day trading through interactive brokers which is normally excellent although I've noticed data freezing a couple of times recently when the market moves quickly. I don't know if this is an exchange or a broker issue and need to look into it.
 
im loving this short. :)

gone negative for the week now (sub 10,260)


am gonna offload 2/3 of position at 10,200, and let rest run
 
SB'ing, YM, ES

Just read FC's earlier post on Bias. It definitely does exist ( Deal4free ), I've lost points to it already in my short trading 'career' and regularly witness it happening when I'm not in a trade.
In addition, in 4 of my last 5 losing trades my stop was taken by 1 pt before reversing into what would have been a winning position. Be interested to know if Cap spreads don't indulge in this sort of activity.
As you can probably tell I shall be 'going direct' very shortly, but now the next dilemma, YM or ES
ES certainly seems to move more, yesterday a prime example, -7,+9,-5, but as a beginner to DA should I be more concerned to limit losses and therefore trade YM with it's smaller range and narrower tick size.
Any advice appreciated,
hampy
 
Friday 10th September 2004

Another ugly one for me. Well done to all those who bagged the long. Finally an 80 point range (wow).

Changed to December contract.

More divergence after open between DJ (which has taken out recent lows) and NQ (which has taken out recent highs).

10:14 Had PD on lows (but this included low from open so perhaps not relevant). Was waiting for possible long on more PD at 32 but it didn't make it. Wary of going short on return to 100 ema now.

10:31 TRADE ENTRY: Short at 10260. Apparent resistance at 64/100 ema with TLB on CCI/RSI. Just teasing me though as it immediately springs into loss, taking out 64 to the upside and moving above 100 ema. I guess the divergence should have kept me out. Pops back down after hitting yesterday's LOD and moves to decent profit.

11:07 Hard bounce before taking out LOD. ES and NQ went no where near their LOD and upside looks likely now.

11:17 Hits 100 ema and back at entry. No follow through again. Up through 100 ema. Up through 64. Then just goes no where. For two hours. And counting

13:16 Looks like a false move down with PD and then sharp move up, no doubt to stop me out! New highs on ES. Volume kicking in. But against that it looks like a perfect bear flag on 5 minute chart but unlikely to rescue me now. Also, very clean trend line support on ES from opening drop. This has to break for short to have any future.

13:58 Trend line on ES brakes and markets move down but no immediate follow through. In fact no follow through at all. Either way. Unreal.

14:17 It's going up. The break was clearly the fake.

14:26 Market finally breaks out of its 30 point range after nearly 5 hours ... but the wrong way.

14:36 TRADE EXIT: Stopped out -30 (bad fill to add insult).

15:11 Possible triple ND CCI plus volume divergence plus reversal bar. Won't go long against this with less than an hour left in the week.

What can I say. Not a good week.

-30 from 1

-50 for September so far (7 trading days)
 

Attachments

  • 20040910.jpg
    20040910.jpg
    169.4 KB · Views: 243
A bit of a slow day until after lunch.
1st entry was on the pd with an exit on the bounce off 64 for + 24.
second entry was on the break of 270 exited on the nd giving another +22.
this was where it went wrong i reversed off the nd which was a really stupid mistake to short against the trend, and gave back 20 pts when my stop got hit. I wouldnt have felt so bad about it but i keep making the same mistake on the nd's in a trend.
But i guess +26 for the day was good going seeing as it didnt look like it was on the cards from the morning session.
 

Attachments

  • chart.GIF
    chart.GIF
    27 KB · Views: 253
Tony

Sorry to hear you had a bad day again today and generally a bad run to date.

270 was offering resistance today, it bounced down off it three times today.

Once it had broken 270 at about 19:27 gmt I would have got straight out and cut my losses as it was unlikely to come straight back down.

CM's "pull back to the EMA" system works well on a trending day but you only tend to get 4 or 5 of these per month. We've had 4 days of narrow ranges this week where to make a profit you need to be able to trade the swings and not follow the trend.

I wouldn't hold a position all day long hoping for a big move in the right direction. I'd rather look for opportunities as they come up and if they don't go in your favour then get out quick for a small loss (or profit) and look for the next opportunity rather than spend all day managing a trade swinging between losing and winning hoping it will hit the jackpot.

If you look back to about 16:30/17:00 GMT yesterday you will see 270 offering support - always worth keeping S/R lines from the previous days.

You went short at 260 and it carried on up to 270 resistance before bouncing back down. But then it bounced off 240 support where it had bounced an hour earlier. This would have been a good place to exit for a profit - RSI was around 25 and you had evidence of a support line so best to get out while you are ahead and see what happens next.

As you know from the chatroom I shorted the next bounce down off 270 but at 16:56 gmt - RSI was down to 25 again and the price only down to 255. It wasn't going as planned and 240 looked unlikely this time so I took an exit for +10 - better than nothing all the tens add up!

I hope this is of some help, we're all learning from experience every day!

Justyn.
 
Useful comments from all above, and the learning curve goes on that’s for sure…..

From bearish thoughts early on, I saw it as a long after the double-bottom formed, and although it went sideways for hours, the Naz was steaming north and I suspected that the Dow would try to catch up eventually……

Again, the 5min chart shows the ND RSI exit nearer the top than the 1 min; also nice the way the triangle resistance break coincides with the 100ema……CCI almost acting as a ‘direction’ indicator, showing the way up…….

Have we formed the right shoulder of an H&S or is a retest of 364 on the cards? – Monday’s action should provide the answer……..
 

Attachments

  • 10-09-04a.gif
    10-09-04a.gif
    15.7 KB · Views: 187
Carlos

Sounds like I did the same trade as you - went long on the break above 270 at 19:30 GMT and exited on the 3 pk ND top. (Chart attached)

I kicked myself as the price then shot up another 20 points. Looking at the chart, at point A the price had only slipped back fractionally with RSI moving back down to 50ish - giving room for another push up.

Never mind, won't make that mistake again!

Justyn.
 

Attachments

  • chart.gif
    chart.gif
    11.1 KB · Views: 240
I think I said earlier in the week that if the triangle breaks to the downside, we get to 250.... Either way, the channel reigns supreme, bouncing off the lower support around 250 and reclaiming 300 support.

Justyn- and others, don't get cut up about missing the HOD. Taking the exit on the 3 pk divergences will put you on the right side in the long run.With long term experience, you'llbe able to tell whethere another final push is coming....
 

Attachments

  • dow 10-09-04 10.gif
    dow 10-09-04 10.gif
    35.7 KB · Views: 220
Just a quickie, it's late.... the triangle gave 293 as a target.... What about that PD that went another 20? I have discussed this before, suggesting a hold until the lower support line gets broken. You can see that this time, the price just went below bofore going north to 320.... So a borderline case. You pays yer money and takes yer choice. You have the rules, you have to make the choice, depending on your trading style and risk strategy.
 

Attachments

  • dow 10-09-04 1.gif
    dow 10-09-04 1.gif
    24.6 KB · Views: 263
Thanks for all your comments as ever.

Justyn - it's a tricky one for me. I hate losing and I hate sitting in trades for hours going no where. It takes every ounce of will power I have. I also realised the trade yesterday was probably dead around 2pm when the break down failed to go anywhere. So why didn't I get out?

Well, over a couple of months I've found CM's approach has been very successful for me. I still make loads of mistakes, but generally it helps me limit my losses and run my profits far more than following my instincts has done in the past (the only time I've closed day trades for 50+ and even 100+ point profits before is when my trading platform has gone done and I haven't been able to get out!). I'm comfortable trading large positions (although I've cut right down at the moment) and if I can average 10 points a day I'm happy - 20 and I'm ecstatic. I also find it works for me far more than 4 or 5 days a month.

I've had a shocking few days this month, but I'm actually only down 50 points. Of course, it could get much worse next week, but alternatively, this time next week I could be back on track and in profit. For me, in the past, bad weeks have done me much more damage.

I am learning every day from the trades and all the posts here and hopefully will be applying the method more effectively with every new week. I also expect to allow more discretion again as time goes on. But for the immediate future I am resolved to applying the approach in a disciplined manner. Of course, if the next few weeks keep on losing I may to seriously review this stance!!

Please do keep posting your observations and here's looking forward to Monday.
 
10/09/2004

Hi Guys,
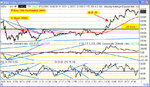
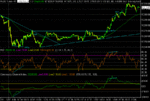
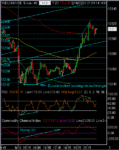
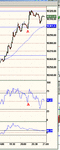
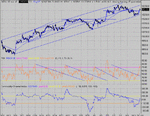
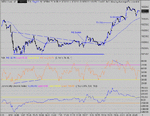
Sorry no chart but you've seen it before:)

As you know I hold my positions for short or medium term trades. Although I was well underwater from my shorts (lots of them) last week, this weeks action has given me profit from them.

All I can say, is that multiple positioning, (allowing higher entry of later shorts) worked again. Mind you it was sweaty for a while:)

I play small proportions of my capital per position, so can afford to carry multiple positions. Providing I don't carry too many positions, I'm OK. There's the rub, I get carried away (often:) and open too many positions. I try to leave 30 to 50 points between positions, depending on how I see the waves, TA etc. but lately I've got it wrong and placed multiple trades within 10 or 20 points. STUPID.

Anyway I closed them all at total Dow profit of 190 points for 6 trading days.

Today's trading; had a couple of very short term longs (yes I can do them:)) from the bounces this AM at 260,255,240 on IB and 259,244 on SB. Closed for -3,+2,+17 on IB and -2,+15 on SB.

Now for the contentious bit ....
I believe that any rise here will be completely retraced to the August lows (9800, best on hourly chart) and will likely go down to between 9000 to 9500 before the December contract ends.

On that basis, it will come as no surprise that I'm reloading my shorts; Today I got in at 253,260,264,273,286,313 on IB and 247,256,261,270,283, 290 on SB.

As admitted, I got carried away and loaded up without decent intervals.

I see a loss if the market keeps on going up here. However, I think we have seen a large ABC since the August lows and so, the lower channel line argument is invalid.

If I'm right, we will either get a final c of C subset (with potential for new highs maybe, up to 10400 or so) or a minor wave 2 retrace (if we've already topped).

At the moment we are just at 62% retrace from the high at 10360.

On balance I'm happy to take the risk and have stop losses at 10450. Interestingly, if you look at a daily chart and draw a line through the tops of the series of lower highs, you get 10410 for this latest legup.

By December the market should be much lower than these levels and I shall keep these "core shorts" and trade around them daily.

Sorry to go on so much, but finally, fwiw, the EW site is predicting a fibonaci date turn for September 13/14th. So +/- one day gives Friday, or Monday, Tuesday, Wednesday of next week. I'm looking for major reversal for one of these dates and just hoping it wasn't today:)

On this 3rd anniversary of 9/11, have a good and peaceful weekend.
 
Tony, Keep posting, I find your contribution really useful, especially when I look at the times and look back to what I was thinking at that time.
One thing that has struck me this week is that I think you may benefit from playing your stake as 2 lots. With half of the stake you could target say 15-20 pts and take the profit at the target, then let the other half run. If the trade continues in your favour move your remaining stop to breakeven and thus 15-20 pts guaranteed. If the 2nd half loses you still have a good chance of getting out even for the day.

Good point from Tradesmart. I was also watching Sox + Naz motoring North and felt only a matter of time until Dow/S+P joined in. I was suspicious that the 3pk was not the top, reinforced by ES where 1024.5 has been major resistance all week. Sure enough the final push went from 1023 to 1025.25 accompanied by a big volume spike. Pub time :cheesy:

BTW, if anyone has read my post from yesterday regarding ES v YM I'd be really grateful for advice/comment.
Good Weekend all,
hampy
 
Hi Hampy,
I can't offer any comment about ES or YM as I don't trade them; but I do have a question for you. I've Just looked at your profile and am intrigued to know if you're able to use / transfer skills from your day job to your trading? I'd guess that you don't have any discipline issues at all!
Tim.

CM et al, apologies for going off topic, but I thought Hampy's reply to this question (if he chooses to reply that is) might be of interest to everyone.
 
CM et al, apologies for going off topic, but I thought Hampy's reply to this question (if he chooses to reply that is) might be of interest to everyone.

No problem....

I see a loss if the market keeps on going up here. However, I think we have seen a large ABC since the August lows and so, the lower channel line argument is invalid

The channel is valid until it breaks...... isn't it?
 
timsk, when I started looking into short term trading 18 months ago, after 20 yrs of buy & hold investing on fundamentals, I was convinced that daytrading was the way to go for me and felt sure my ATC experience would help. You're right about discipline, taking a loss and using stoplosses is already ingrained and I never get the urge to alter a stop or let a losing trade run.
However, my biggest problem is taking the trade in the first place. I think it's the fear of being wrong. ATC always has safety as it's number 1 priority and I think that prevents me at the mo, from taking trades that with hindsight were correct and perfectly safe.
10 years or so ago a trading house in London, advertised for ATCO's to become traders.
I recently discovered that they proved to be too risk averse for that trading style ( don't know what it was ) the same prob I find in myself now.
This is why I find this thread so useful, as CM says his aim is to make sure beginners don't rack up big losses, so this suits my personality perfectly.
Fortunately I earn a good enough salary to practice in the mkt with small stakes whilst working out what method to trade, and I'm currently using CM's combined with China Whites ES stuff and a bit of darksiding thrown in. I feel I am getting much closer to trading it successfully now, if only I can learn to hit that button when the set up appears.

hampy
 
I see a loss if the market keeps on going up here. However, I think we have seen a large ABC since the August lows and so, the lower channel line argument is invalid

The channel is valid until it breaks...... isn't it?[/QUOTE]

Hi CM,
Thx. for your reply. In EW terms a channel is a type of 5 wave impulsive move. If I'm right (a big if, I admit), the move since August is an ABC and so, by definition cannot channel. There is of course a lower trend line which shoud break soon.
Do you guys use the term channel to mean somethingelse? Sorry for not making my comments clearer.
 
Cheers Hampy, - thanx for the reply; it sounds like you're nine tenths of the way there.
;-)
Tim.
 
Yes, my term channel has nothing to do with EW as far as I'm concerned, although there may be an unintentional connection. I have found that the Dow price tend to move from a channel up to a channel down and so on. The channel itself may well be just one part of an elliot wave. These channels exhibit clearly defined top, middle and base lines around which the price rotates. When the price has a major change in direction, the trick is to spot the new channel lines that will provide new support and resistance.....
 
What about that PD that went another 20? I have discussed this before, suggesting a hold until the lower support line gets broken. You can see that this time, the price just went below bofore going north to 320.... So a borderline case

ChartMan - thanks for your useful commentry as always. I don't recall seeing any post where you discussed this before - maybe it was before I was around on here?

Are you saying that when you see a PK ND top you can (if you choose) wait and see if the price pulls back below the last high before deciding whether to exit?

If it doesn't then you should have another push upwards coming?

Kind regards,

Justyn.
 
Top