Dow Intraday Charts 07 Sept - 10 Sept

In post 11 I put the 1 min YM chart that looked wrong to me. I just got another 1-min chart for the day that shows the same period and the bars are completely different. Is this futuresource.com cocking up? Can someone check today's YM with their feed and post here?

Small inset chart is 1-min YMU04. Circled area is around 10:39 to 11:00 and looks wrong
Larger chart is also 1-min YMU04. The same timeframe is circled and looks completely different. Why?
 

Attachments

  • ym_040907.gif
    ym_040907.gif
    34.5 KB · Views: 195
Well, the Wall Streeters often come back from a holiday in a buying mood, so another bullish performance is no surprise, and one gets the impression that the line of least resistance is definitely up……..(for now)

The target of the big 480 ish high ‘W’ bottom formed at the July/August lows suggests that 10700 could be in the sights…….?!...............that might seem far fetched, but so did a return to 10360 when it was bumping along the bottom at below 9800 just a few weeks ago.............!

But now we are right up against the top trendline linking the highs this year, so maybe we’ll see a pullback to form a ‘higher low’ which may give the bulls even more encouragement.......
 

Attachments

  • 07-09-04.gif
    07-09-04.gif
    18.9 KB · Views: 205
Last edited:
Blimey. I feel hijacked by all the Bears :cheesy: Sitting in the upper channel with an H&S so maybe the Bears will grab a hold. Base line at 175/200- that would be a nice move.... I'll wait for the RS switch to get croseed....
 

Attachments

  • dow 07-09-04 10.gif
    dow 07-09-04 10.gif
    38.3 KB · Views: 266
Easy day? not bad with the divergences, except the last gasp at 364 before the drop.Tomorrow? The concensus seems to be down so I'd better say downnnn....
 

Attachments

  • dow 07-09-04 1.gif
    dow 07-09-04 1.gif
    27.1 KB · Views: 219
TraderTony said:
Tuesday 7th September 2004

Markets closed yesterday for Labor Day.


For my first 'proper' month as a full time trader, September has not exactly got off to a very good start!!!


Hi Tony,
I made virtually the same mistake as you on the first trade.

I think, looking back that maybe the extremely weak rsi/price ratio was a major clue to close out of the long? (see chart). Shame I didn't spot it at the time :rolleyes:

Thanks for your notes, which I reckon will be a valuable resource for you as the diary builds.
I'm going to be making more notes now to try and improve my efforts.

Well done for limiting your losses- it's not easy to admit the failed trade if emotions are allowed in!

Thanks again TS,
best regards,
Neil
 

Attachments

  • cm07-09-04.jpg
    cm07-09-04.jpg
    87.4 KB · Views: 255
Re #21, futuresource had a messed up CBOT data feed for a few hours hence the problem if anyone else was curious.
 
Wednesday 8th September 2004

This first trade was really really stupid....I think the recent losses are making me jumpy, trying to second guess entries. I got away with it but I am not happy with myself:

10:00 TRADE ENTRY: Short at 10330 (10324 on YM) when support at 32 appeared to give way after several tests. Snapped straight into big loss (right off the 100 ema - I clearly should be long) and up to top edge of triangle. Breaks triangle to upside but no real upside volume. Still, could close gap and test yesterday's highs now. New HOD. Gap closed on YM. Very very choppy and trade badly in loss but still no real conviction to upside (possible third leg up too). They won't let it drop (yet) though. No doubt they are waiting for everyone to go long before pulling the plug.

10:29 Should have been stopped at -35 (hard stop) after I decided to trust my hunch that a drop was imminent but I wasn't filled and eventually it did come down. Oscillating above and below the 100 ema without breaking more than 20 below (so could reasonably still be long). Messy.

11:37 Breaks back to the upside but again no real follow through. Flip flop John Kerry day.

12:20 Down for new LOD but still no follow through and still not 100 ema -20. Then sharp bounce up on small PD but no clear exit signal yet (if indeed short is a valid position here).

12:48 TRADE EXIT: On messy three low PD (albeit only over 21 minutes) but stronger and clearer on ES. Shouldn't have been in the trade anyway. +10.

13:07 Pulls up above 100 ema and stalls at 32 (for umpteenth time already today). Could however be breakout of large triangle from today's high. Then breaks up through 32 but some ND on RSI.

13:28 TRADE ENTRY: Long 100329 (YM) as index pulls up from 100 ema through 32 level for second time. But immediately stalls and fails to take out swing high of a few minutes earlier. Then crashes down into loss. Do I have the lead touch at the moment or what. Ema holds move down at first but price just refusing to move away from this 100 ema today. Tight congestion range, going nowhere. Third peak stops dead at congestion resistance.

13:53 Finally breaks up on index but ES and NQ fail to take out their swing highs at first attempt. It's just like the market is in super slow motion today. Then stalls at mid morning swing highs around 10345 and suddenly drops sharply after ugly reversal bar before spiking up to new highs but again it drops straight back off. This is butt ugly. Falling back to wards entry and wham - into loss. What the hell is going on here? It's just jumping all over the place. New highs on NQ but not ES, YM or DJ. And jumps right back down again. Prices on futures are just bizarre and are making me very uncomfortable.

14:27 Index makes a move up but not followed by futures. Then up and straight back down. I think this is the oddest price action on futures I have seen. And after all that I'm losing.

14:38 TRADE EXIT: Closed at break even as I hate this action. I'll call it quits there and watch the footie as I don't want to force anything when we've had a 45 point range with less than 90 minutes to go - so wait for it to finally put together a good move into the close!

Two 60 point ranges on the trot - tough stuff.

+10 from 2

-18 for September so far (5 trading days)
 

Attachments

  • 20040908.jpg
    20040908.jpg
    214.4 KB · Views: 218
A good read TT....

Still in the channel, no sign of PD...abd sitting on 300 solid support. If that goes, you know what to do... The current triangle will take us to 364 to the upside or 264 ish to the downside.
 

Attachments

  • dow 08-09-04 10.gif
    dow 08-09-04 10.gif
    36.3 KB · Views: 217
Tough going as TT said, with not much more than a 40 point range all day. Just note the carry over from yesterday at the open.... It can often help taking an opening position.
 

Attachments

  • dow 08-09-04 1.gif
    dow 08-09-04 1.gif
    28.1 KB · Views: 214
08/09/2004

Hi,
Sorry, but can't provide charts. My charts are in pdf format, if anyone knows how to change them to jpg, please let me know.
Since last week, not much has changed for me, rather like this market.
I added in 2 extra shorts near the top at 10318 and 10343 on Tuesday; closed them yesterday for the priincely profit of -5 and +20.

Still carrying heavy shorts which started from around the top of that consolidation at the end of August. Looks like that was a B wave, which I thought would retrace. Didn't of course. A=354 points, so this latest high puts C at 82% of A. If A=C, puts the target at 10410 to 10430. On the hourly chart there's a whole raft of negative divergences, and MACD has crossed for down.

I'm still holding out for this whole move up since 9800 being a corrective which i expect will completely retrace, maybe by the end of October. (Painful at the moment but there you go). If the market turns down, there's upto 1000 points to get down. I see upside risk with this last 5 wave set from 10080 to 10370; if it's C then down down down. But what if it's 1 of 5 to come?.

I've raised my close level to just above 10430. In the short term, will review when / if the market hits 10200.

For now, I'm 60 points (SB) and 90 points (IB) underwater with 13 positions exposed.

Awaiting the 8:30 US data with interest:)
 
Last edited:
looking genuine-ish now.. trendlines overhead should limit upside bounces (famous last words.....)
 
Thursday 9th September 2004

The fouth 60 something range day on the trot. Happy days. Not. Anyway, here's how it went for me.

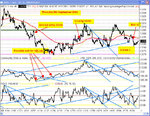
9:50 back at 100 ema after early move up but just 10 mins to economic numbers release. Then drops below.

10:08 Drifts down mildly after numbers without any significant volume towards yesterdays low. More numbers at 10:30 so may leave it alone whilst it remains so uncertain as to direction. Still hasn't made it to 20 points either side of 100 ema.

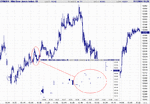
10:26 Strong bounce up to 100 ema ahead of numbers but still no numbers. If we don't get some direction soon I'm going to look at fading moves away from ema instead of pullbacks to it. Up through 100 ema on news. Then straight back down and after a few more wiggles back to LOD, then takes out LOD/yesterday's LOD but still no volume. 300 level next.

10:48 Breaks 20 below 100 ema for the first time since about this time yesterday. Then springs up again. Fails at 300 and drops. I guess the evidence is that we are in a downtrend here but it doesn't feel very convincing to me.

11:00 Back above 300 but drops sharply off 305 level (earlier support) and with some volume this time. Now we're going down for real but I missed entry short as I was waiting for it to get closer to the 100 ema and it turned so quickly. I was very reluctant to chase in case it was another flip flop move.

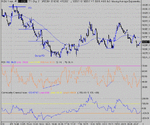
11:28 Continues to move down nicely with new lows. Can't believe I've waited so long for the market to start moving and then completely missed the entry. Lower volume on this drop and first PD on CCI.

11:47 New LOD but triple PD on CCI so first good exit around 10274 if I was short (+20-25). Then again it could just be a bear flag before another move down. Sadly, it's just academic to me. Even clearer PD at 12:00 (volume divergence on ES too).

12:11 DJ back to its 100 ema as ES pulls above. Now I have a dilemma - look to get in late on a short or stay clear because of the triple divergence (I got burned entering short after a triple PD on Monday).

12:16 Decide to stay out having failed to grab the earlier points - but it is charging back down. Not much volume this time and prices a bit jumpy. Then roars back up. And down as 100 ema holds a second time in rapid succession. Boy!

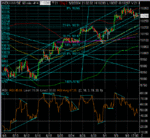
12:33 Third upside attempt on the 100 ema. And fails again. Forming triangle. Which breaks to downside. Well, I've had enough opportunities to get short! Must have lost my nerve. But wait, again it springs back up. This is messy. 5th attempt at 100 ema. Breaks above the other 4 highs this time. OK - this time the up move might be for real. Nice to see it take out 100 ema +20 for clear signal to look for longs. But ugly ugly reversal bars before it hits 300 level. Maybe that was just a big tease.

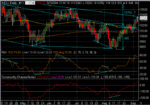
13:15 TRADE ENTRY: Long at 10292 after consolidation above 100 ema. A bit premature as it hasn't taken out 300 yet. Moves up to 300 and, predictably, stalls with first ND - not a good sign. Futures all look pretty strong though. Now needs to take out 305 (earlier S/R) and push hard up wards. Nope, 305 sends it crashing back on first attempt, with some volume too. Has another go and gets through with some decent volume but now heavily O/B. Ugly reversal down then another push up that falls short of earlier highs and drops even more quickly.Need some consolidation here to preserve the long.

13:47 Another push up fails to trouble last highs. Stalls again right at 305 level. Making me nervous here. And dropping. 100 ema needs to hold it or this long is dead. And into loss as it cuts straight through ema. Arrgghhh!

14:06 Pulls back to 100 ema from below but looks like a big ugly bear flag before a drop down to new LOD. Yep, down it comes. Oh boy, this is horrible.

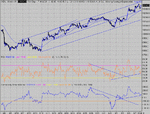
14:21 Possible TLB to the upside (on price and indicators) although volume not great (but then it wasn't coming down). Needs to start taking out some swing highs. Back towards 300 and above 100 ema but not holding. Interesting that DJ and YM lagged both ES and NQ in up move as they came close to their earlier highs (equivalent to 310 level on DJ). And down they all come - with YM leading the way.

14:40 Possible PD off low (but really clutching at straws here). Moves back above 100 ema. This time it needs to hold. YM/DJ definitely weaker than ES/NQ which are moving up nicely and have both taken out 13:26 highs and hit new HODs. YM/DJ do not want to seem to go up. Last up, first down, every time.

15:00 YM and DJ very volatile as 13:36 swing high approached. It's like they are being pulled up, kicking and screaming, by the ES/NQ and will bolt back down on any slight excuse.

15:22 And down they crash below 100 ema without even taking out the 13:26 high, let alone the early HOD.

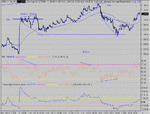
15:35 Bounces off support and up to 100 ema once again. Less than 30 minutes left in another 60 something point range day (so far) so I'm going to cut this if it starts dropping hard again.

14:47 TRADE EXIT: -2. What a joke.

-2 from 1

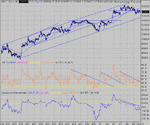
-20 for September so far (6 trading days)

I cannot seem to buy a winning trade at the moment. I think I've had as many losers in the six days of September as in the previous 6 trading weeks. And I know I missed a twenty pointer or so this morning but I've had just one decent winner in the month so far. I haven't changed anything significantly about the way I trade so assume it's just down to a tough market right now. Pain in the backside though.
 

Attachments

  • 20040909.jpg
    20040909.jpg
    219.8 KB · Views: 213
Last edited:
Yes, tough day again....but broke the mid channel line early on with an attemt to recover the lost support.
 

Attachments

  • dow 09-09-04 10.gif
    dow 09-09-04 10.gif
    37.2 KB · Views: 212
OK if you ckocked the 32 failure and went short...But even if you missed it, there were 7 waves down to pick a pullback at... and the Bump PD should have given the exit. Apart from that, another tough day....
 

Attachments

  • dow 09-09-04 1.gif
    dow 09-09-04 1.gif
    28.1 KB · Views: 211
Excellent comments as ever CM. I am kicking myself as I was just too cautious on that short. I completely missed the failure at 32 and then I just wimped out on the other waves because I was anxious about entering too far below the 100 ema after so many reversals back to it over the past few days whenever the price got more than about 15 points away.

Whilst I'm down overall for the month so far 20 points or so, the good news is that I can remember all too well that tight days like this in the past (before starting to follow your approach) have often each cost me several times that and really damaged my account.
 
Looks like an bearish H&S developing, but depending on the data released at 13.30 bst today, it could still reserve the right to test 364 again imho………

However, I noticed that the Naz formed a double-top at 1875 yesterday which may back up the short term downside possibilities for the indexes…..

TTony – have you considered running an ongoing ‘trending’ position in a second account to take advantage of the bigger multi day moves, and back up your day trading....….?

Interesting comments in your trading diary and I’m sure that you'll be raking in the points soon……..


Edit – spooky…!?……Just reading Charlie Miller's newsletter, and he has noted that today, the eve of the third anniversary of 9/11, the Dow is at almost exactly the same level as it was before that fateful day…

I wonder if this will influence/subdue trading today……?

Edit - 20.42 - so much for premature Naz "double-top" talk - now 1895........ :confused:.......pulled the Dow up nicely though.....!......(nice if you're long that is....... ;))
 

Attachments

  • 10-09-04.gif
    10-09-04.gif
    25 KB · Views: 184
Last edited:
Instruments Used By Posters? Resulting Slippage?

I note from reading the PDF document outlining ChartMan's strategy that it implies that spreadbetting is the mechanism used to bet on the Dow. Notwithstanding this advice ChartMan advises that one should not pay much attention to the SB prices when putting on a trade because of the bias.

What are the mechanisms used by the people posting on this board?

In cases where people are using spreadbetters does the "bias" so often alluded to in other posts cause slippage and if so to what degree?
 
since i mainly trade counter-trend, the bias (not that it exists) means i get taken into trades that i would not normally get into, were it possible to trade the daily cash index..

therefore, the bias, should it exist, would help me, rather than hinder me.


clear as mud, eh?

:)
 
capitalspreads actually. pretty impressive IMHO.

too many SB's complicate the matter of trading, by having complex platforms..

all it is , is buying and selling. and thats it.

nice and simple...
 
Top