You are using an out of date browser. It may not display this or other websites correctly.
You should upgrade or use an alternative browser.
You should upgrade or use an alternative browser.
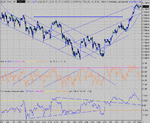
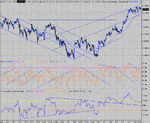
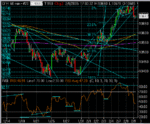
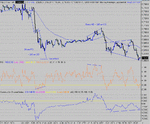
But not today. Looks to have been a real sit on hands day. But what is developing here? Could it be a Bull flag with three cycles? Tha would suggest that a drop to 664 for support then a run up to test 700. At that point, it will be decision time. Check CCI heading for that support line and look for the bounce.
Attachments
TraderTony
Active member
- Messages
- 180
- Likes
- 1
9:55 1) L 10705. Not much of a trend so far though so a bit hit and hope. Not much follow through. Stop to b/e at +6. Needs to take out Friday's HOD at 720 to go anywhere here.
10:13 EXIT: B/e.
[Alternative hypothetical exits: Trailing stop = B/e. Target at +6 hit, +12 not hit (average +2 from 3).]
Interestingly, the original stop of 703 held for another push up to new HOD (at Friday's HOD) but eventually did get hit.
Gentle creep upwards but trend never looks strong enough for me to take an entry, especially as it stays around Friday's HOD.
12:31 2) S 10709. Immediately looks bad. Down move probably just a correction. Absolutely no follow through, let alone testing 700 level. A break up looks more likely now.
12:47 EXIT: -5. [-5 on all hypotheticals too].
Could have reversed long at that last exit but didn't seem there was enough action.
14:14 3) L 10708. In too soon - there is no clear trend yet. Impatience got the better of me I think. Finally a little push up. Stops to b/e at +6.
14:37 EXIT: B/e. [Alternative hypothetical exits: Trailing stop = -2. +6 hit, +12 not hit (average +2 on targets)]
As with trade 1), the original stop held for another leg up and would still be holding anhour later.
Well, it might break out in the last 30 minutes, but I won't be trading it.
So perhaps not surprisingly, in the tight conditions, the fixed target exits would have performed best. Tough day all ways round really though.
-5 from 3
-8 for the day after comms.
+98 for February so far after comms. (5 trading days)
Hypothetical alternative exits:
Using +6/+12/+30 targets = -1 average
Using swing high/low trailing stop = -7
Attachments
yesterday
for those interseted in chart patterns, please try
thomas bulkowski " encyclopedia of chart patterns" try t2w or type in thomas bulkowski into your search engine...its expensive but very worth it
it is definitive and all anyone will ever need. honest!
regards
wellshot
for those interseted in chart patterns, please try
thomas bulkowski " encyclopedia of chart patterns" try t2w or type in thomas bulkowski into your search engine...its expensive but very worth it
it is definitive and all anyone will ever need. honest!
regards
wellshot
Attachments
TraderTony
Active member
- Messages
- 180
- Likes
- 1
gollum said:did anyone else have a data feed prob for q`h at 15:30. On my chart the feed does not start again until 20:30 US time yesterday.! Mytrack tell me it's the same for everyone but i want to check on them...
Something definitely strange with my after hours charts yesterday too using Sierra/MyTrack.
TraderTony
Active member
- Messages
- 180
- Likes
- 1
9:41 1) S 10696. Cannot break 92. Twice. Three times. Four times. So not looking good.
9:48 EXIT: -6. Quad bottom killed it. [Hypothetical exits: trailing stop -2/ targets not hit so average -6]
9:57 2) L 10708. Try the other way. Stop to b/e at +6. Seems to be stalling at 720 level - just below yesterday's HOD and Friday's HOD. Fils again at 20 level - not a good sign - it needs strength here. And it's coming back to the stop. I'm syrprised it hasn't even tested yesterday's HOD - looked very positive straight after entry. This could just be a pause but it looks like it will take me out before going up again. Then another push to yesterday's HOD. Which stops it dead and smacks it back down. This is over. Or not as it suddenly turns up and surges through to new highs. And target. Which just goes to prove how little I know about judging exits.
10:37 EXIT: +30. [Hypothetical exits: trailing stop +6/ +6, +12 and +30 targets hit so average +15].
Potential double top soon after then chop.
Missed short entry just before noon (725) but would have closed at b/e if stop moved at +6. Re-entry short at 722 was also eventually stopped at b/e after support at 700 level (so plus +6 and +12 would have been hit). I still struggle to enter at a 'worse' position if I think I've missed the 'proper' entry.
Then chop/slow upwards grind that I left alone although there were some decent entries.
Suffering entry paralysis today but lots of red bar green bar red bar green bar shuffle. Might be better to keep my profits in the bank. Yep - I'm out of here.
+24 from 2
+22 for the day after comms.
+120 for February so far after comms. (6 trading days)
Hypothetical alternative exits:
Using +6/+12/+30 targets = +9 average
Using swing high/low trailing stop = +4
Attachments
tradesmart
Experienced member
- Messages
- 1,286
- Likes
- 22
Well done Ttony…
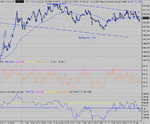
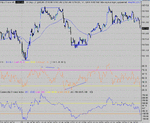
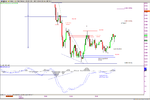
Seems to have spent the whole session today building a triangle against 740 resistance and the after market fall has observed the rising lower line…
Apparently good results from CSCO after the close but the shares have fallen – will it be enough to move the market after two narrow range ‘consolidation’ days……?
(assuming that the Dow will track the Naz to some extent……. 😕 )
Attachments
trading price action
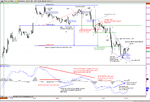
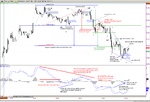
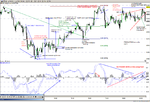
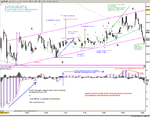
i offer my "view" of the remainder of todays price action in an effort to illustrate my posts on last weeks thread....
i apologise for the mess in advance and present these three charts in the full knowledge that most of you will see them as all to obvious
i having nothing to teach and offer them in the spirit of taking part. thats all
i did a shed load of this stuff this time last year [much more in the vein of predicting target] but covered in elliott wave, my prefered way of seeing the world.
i won't be doing anymore of these and ir remains for me to thank you for your thread and for having had a look.
good luck to all
i offer finally in the spirit of those who have helped me in the past the following references
www.elliott-wave-theory.com
thomas bulkowski "encyclopedia of chart patterns"
best wishes to all
wellshot
Attachments
tradesmart
Experienced member
- Messages
- 1,286
- Likes
- 22
TraderTony
Active member
- Messages
- 180
- Likes
- 1
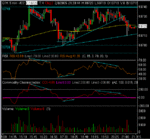
I made a hopeless dog's dinner of today...
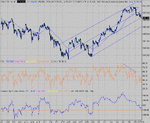
9:54 1) S 10724. Still not through yesterday's congestion so risky but tight stop. Cannot break below 720 level.
9:58 EXIT: -4.
[Alternative hypothetical exits: all -4]
10:05 2) L 10735. No follow through this side either.
10:09 EXIT: -5.
[Alternative hypothetical exits: all -5]
Miserable start. And it crashes downwards to 700 level without me. Not a happy bunny.
Hesitated and missed excellent entry at 701. Stops would have gone straight to b/e as it dropped away. Freaked out by proximity to 700 level.
Data feed on charts suddenly lagging badly.
10:31 3) S 10691. Try again. Down well. Stop to b/e. Then heavy support around 678/80 level. Do not like it. Needs to drop again quickly here or I'm in trouble. No - it just bounces every time. And up it comes. Unbelievable support at 78 - so strong. Finally pokes down below 78 but straight back above again. Someone is holding firm to resist the down pressure. Move looks to have bottomed in low 70's. Yep - this is dead.
10:50 EXIT: B/e. Well, we had a 60 point down move and I didn't manage to get a winner. Not very good.
[Alternative hypothetical exits: Trailing stop = +7. Target at +6 hit, +12 hit (average +6 from 3).]
Interestingly, my original stop on that last trade at 698 held all the way through the sideways action until finally getting stopped out over three hours after entry!
13:36 4) L 10701. Going no where.
13:39 EXIT: -4. This is getting ugly.
[Alternative hypothetical exits: all -4]
Charts lagging again as soon as prices start to move.
14:07 5) S 10686. Moves quickly and stops to b/e but then hits a brick wall at earlier LOD at 673 and bounces hard. Go on, follow through. Please. Pretty please. Nope - it's coming back again. Looks like we've got a double bottom. But surely they will at least engineer a fake out before running back up? Just like this morning's trade that just wouldn't go down despite everything (including other indices) looking weak. Then they do give a new LOD but it spring back so fast I'd say this one is dead too. There is just no selling at the lows. Then pops down again but bounces all the way back at S2. This lack of follow through is killing me today. Twice I've thought I had big winners and both have failed.
14:37 EXIT: B/e
[Alternative hypothetical exits: Trailing stop = +7. Target at +6 hit, +12 hit (average +6 from 3).]
This is really starting to hurt.
14:41 6) L 10687. Stupid. No follow through at all. Why on earth did I take this?
14:45 EXIT: -6. Fool. Where was the up trend?
[Alternative hypothetical exits: all -6]
Well, that was a revenge trade. Don't do it.
-19 from 6
-25 for the day after comms.
+95 for February so far after comms. (7 trading days)
Hypothetical alternative exits:
Using +6/+12/+30 targets = -7 average
Using swing high/low trailing stop = -5
So again without follow through the quicker exits had the edge today.
Also, I note that trade 5) would have remained open to the close for a decent 20 point profit had I not moved the stop to b/e - the second big win this has cost me in four days. Of course, it has saved me a few losers too, but so far I think I would have been better off to have left the original stop on all trades.
Attachments
Similar threads
- Replies
- 0
- Views
- 1K
- Replies
- 0
- Views
- 2K

