Dow Intraday charts 02/08 06/08

ChartMan

Legendary member
Messages
5,580
Likes
47
Don't forget the chatroom start up tomorrow ( Monday ) at 1pm sharp, or earlier if you want...... I'll be kicking off the session at 1pm.. It would be really good if it became well supported again. I won't be easy,but there seems to be some good starting support. It will all depend on everyone contributing instead of just being in there like a lemon.Go there and learn something.If you are one of those that can't do anything whilst concentrating on trading, pop in when you have a break.... I guess the most important thing will be for those that are in there to learn as well as contribute and for all to bounce ideas of everyone.Just remember, no one person is going to be right all of the time and no one ( myself included) can remember all of the tricks all of the time.I often miss the blindingly obvious.
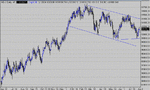
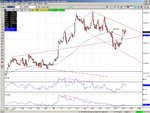
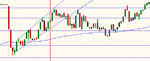
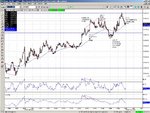
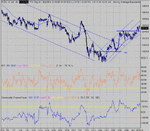
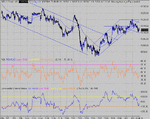
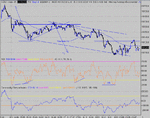
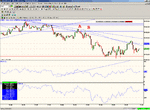
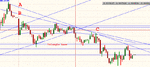
My Dow comp entry is 10,332. Check the chart. I'm banking on an important concept- TA works in all timescales. I know that in a bull flag on a 1 min chart, if the final low fails to make support, it is a precursor to a breakout to the upside, enabling an early entry. The Dow Daily chart is exhibiting this feature. I think you have to go back to Sept. 97 to see another one.
Why 332? Because it's between 200 and 400 and one number is as good as the next! I
 

Attachments

  • dowdaily01.08.04.gif
    dowdaily01.08.04.gif
    22.4 KB · Views: 433
CM - Impressed by your success last week, and with full technical justification; I have placed my Dow Comp entry for this week at.......................................


...................................................................................


.......................................................................................


*10320*


well, do you need an excuse for being influenced by a 'top' trader.................?........... :LOL:
comment from CM...
U git. :))))

CM
 
Hi CM

Thanks for today. :D

As discussed on chatroom ive attached my chart with pullback in question on
thanks

Spencer :cool:


I'll add my comment here. The time you said in the chatroom was not what I was looking at. Your pullback is 100% correct. In this case, it was just 1 bar. It could be several, it could be a flag. All are valid types of pullback and serve to provide a target calc. Let's see how the calc pans out in my charts tonight.
ChartMan.
 

Attachments

  • djia.JPG
    djia.JPG
    191.1 KB · Views: 518
Not a very exciting day for me, didn't see many chances for a good entry.

At the open I thought I saw a flag (chart attached) and when it broke I thought I was seeing the continuation of the drop at the open.

I am not very familiar with flags, would appreciate any input? Was it a flag that failed? Was it not a flag?

I didn't see the triangle forming later in the day that caused the price jump at 18:09 and then carry on to 190 and I still can't see it very clearly with hindsight. It must be an ascending triangle starting at the open if it gave a target of 190?

Just how clear and well defined should a triangle be? As a novice I can end up drawing lines everywhere and wondering whether I am imagining triangles or not sometimes!

Thanks EVERYONE for your input today, useful to see other people's perspectives as it unfolds.

Hope to see you again tomorrow!

Justyn.
 

Attachments

  • chart.gif
    chart.gif
    5.1 KB · Views: 379
Last edited:
Justyn, the concept of the flag is correct. BUT.. It shows up in the middle of a move. This 'flag ' developed from the open as everyone was feeling their way. You have to discount the gap as an invalid element in the flag formation. You will learn that the open is full of tricks and the unexpected.....
A flag is a series of cycles that are "testing" a price range.Typically there are 3 cycles. Why 3, I don't know, but everything comes in 3's.... I guess it's the big boys accumulating for the next push up ( or down).Why they produce reliable targets, I don't know either, but they do.
Just for the record, don't take what I say for granted, PER SE. If I say something, please take the trouble to prove or disprove it to yourself. You have to build your own confidence in trusting what you see and what you do, and the reasons why. ( or why not).
I discussed today in the chatroom why I wouldn't take a short on the pullback under the 100MA. I hope that was clear. For any given situation, there will never be a clear cut answer. Some are easy to decide, some are hard. The rules that I have devised over time are to save a newbie's A** from getting severely singed. To turn those rules into a reliable trading strategy will take considerable experience from new traders as you come across ever changing situations. The more you trade, the more often you will see things that you have come across before and know how to deal with. It isn't going to be next week sometime.... Use those simple rules to keep yourself in the game, whilst at the same time increasing your knowledge base.
Congratulations to the guy who got out at 190 on that 3rd ND peak. It doesn't matter that we closed at 200. You were no doubt able to relax and watch the ensuing story unfold and take in what happened. I missed the close, and was surprised to see it had reached 200.
 
Hi all

Quite a slow moving day today i thought, rsi gave no clues as to which way we were going. until 13:00 that was when we got some movement. then i managed to get some trades in. :LOL:

i've attached my chart with entry exits etc.

hope to see you all in there tomorrow again. :cheesy:

Spencer
 

Attachments

  • djia.JPG
    djia.JPG
    202.1 KB · Views: 425
Onto the analysis. In short, a recovery from the panic drop over the weekend. Notice the result. A new parallel support line has been formed. This tells us that we are back to status quo, but the origin has moved down 40 odd points.This will be our new 10 min support line.
There is also a new horizontal support line across 158 ish. There is more significance attached to this where it intersects a rising support line. ( converses is valid too).
Look back a bit to the 10K line..... where did it intersect a rising support line? What happened next? You have to accept that the channel lines were drawn in retrospectively on a best fit basis. BUT with hindsight , they WERE correct. Today's new support line is a guess. But it looks and feels right, so it must be. Forget the textbook definitions of a trend line, they're just a guide line. That's not to say that we don't get text book trend lines in the Dow. We do.But sometimes you have to chop out the "erroneous" peaks/troughs to get a best fit line. The only time you are likely to get caught out is at a major price reversal.
Take a look back at last week's posts and see where I attempted to guess the best fit as we came off the bottom. I didn't know we were going to reverse.Did you? I don't think it matters. What does matter is that you make an honest attempt at something and you use those lines to help in your decisions.
 

Attachments

  • dow 02-08-04 10.gif
    dow 02-08-04 10.gif
    42.1 KB · Views: 408
Hi CM, thanks for your reply.

I thought I was learning from experience, one day last week was fresh in my mind when the open was as per the attached chart. The price dropped from 10100 to under 10010 following what I saw as a flag.

I guess no two days are the same, and as you say beware what happens at the open.

Justyn.
 

Attachments

  • chart2.gif
    chart2.gif
    6.9 KB · Views: 360
The open was going to be tricky! Best to sit these out and wait for a clear cut entry. This was the triangle breakout at 150. There then followed three groups on ND tops. With the first across 25 minutes, if you took an exit, there really was no other choice. Only gamblers would have stayed in On the basis that it looked like T1 at 160 was not going to be met, an exit was the correct decision. From time to time you will find that the correct decision didn't turn out to be the optimum. Don't be fooled by this and risk a gamble next time. I am willing to bet the next time, you will lose. You'll quickly find ( if you haven't already) that once you get hooked into a loser, it's a bitch of a thing to let go of.!!!! When you get a disappointment like this, walk away and have a cup of tea. Getting angry = easy losses. Remember that saying about 'he who can keep his head whilst all around are losing theirs'? If you can keep a clear and calm persona, you're well on the way .Getting rattled puts you firmly in the "loser" group.
Thanks to all that came into the chatroom and nice to see the 'beginners ' asking questions without being afraid of being labelled 'beginners'. I hope you all learnt a little something.
 

Attachments

  • dow 02-08-04 1.gif
    dow 02-08-04 1.gif
    30.2 KB · Views: 370
Justyn,

FWIW, I sometimes use 5min rsi to spot potential nd's and pd's for s/r levels (thanks to TS).
These can eliminate ambigious flags/pennants etc.
 
Here's the difference Justyn. On the day before, the 10 min chart had reached resistance. Normally, there is only one way to go- down to support. This ONLY works IF you know where support and resistance are. ( even if you take an educated guess as I mentioned). So from resistance, seeing a bear flag is a safe bet.
Today ,the drop was due to scaremongering news. ( only time will tell if it was justified or not). The point is, news that is scaremongering that forces a big price move, will not be sustainable and the price will return to "status quo"... I had a small long over the weekend, that has turned out good, but pre market is was well down.
I can totally see where you were coming from. Try arguing from both sides next time and see what you come up with. I know, that's easier said than done if you only have a limited amount of knowledge to call on.That's where it gets tough and you have to persevere.
There are members here that have followed me from the early days and have moved onto refine their own methods of trading. TS ( TradeSmart) is one of them. As Faz says, using 5 min charts can help resolve 'indecisions'...... But you still have to learn those techniques.
 
Hi Folks,
Just a couple of things I noticed, might be useful to someone.....
Anyone else use the 300ema for today? It worked very well as a support line with a couple of bounces off at X and Y.

My entry was at A, the pullback towards the 300ema and I got a good quote for a long of 10124 whilst the price was at 10127. The sb bias working slightly in my favour. They did me at the other end though. At B I was looking to get out at 190 ish but this time I was chasing the bias and the best quote was 179. It's certainly worth timing the trades to get the bias in your favour (imho)
The 10150 / 10160 s/r's seem to work well; If you select the sierra chart horizontal line options and draw them in, you can see some repeated tests of these occuring historically-check out 29/7/04 around 17:29 ish- the price bangs around inside these quite frantically, as if trying to smash out in desperation!

All the best,
Neil
 

Attachments

  • DJI-02-08-04.jpg
    DJI-02-08-04.jpg
    45.4 KB · Views: 309
I'll give Sally 10/10 today for pointing out the Bear Flag on the 30min chart. I commented that it was a possibility as the current cycle had faile to reach the peak. Look at the action. It just fell straight out of bed. Who says a chat room is pointless? There is good feedback sofar from thoses that have been there.... the feeling is that they are generally bouncing lots of ideas off each other, helping prevent knee jerk and boredom trades....The 150 crospoint was decisive.
 

Attachments

  • dow 03-08-04 10.gif
    dow 03-08-04 10.gif
    38.5 KB · Views: 302
Having got the first few tops and a trend line drawn in, the guess lower support line ( parallel) was a good choice, finally bouncing off it towards the close. Notice the nowhere PD bounced off the resistance line too . You would only see this if you use "projected" trend lines.
A tricky day, but probably turned out good if you followed the 10 min channel break. I know Sally was a tad chuffed. :cheesy:
I discussed the options at 15:22- wait till a break of 150 or look for a bounce of 132. Trading in between would be a gamble.......... Turned out that 132 was the way , and ES showed a 3 x blow off vol spike at 11000 compared to 3,000 average. Nice place to go long....no clues for a get out, except multiple tests of 164 before finally failing. I know some of you got in a short based on 64 failing and the price pulling back under the 100MA. Having the projected trend lines and the T1 from early in the day + the OS RSI at 20 gave ample opportunity to get out nice and low around 110.
 

Attachments

  • dow 03-08-04 1.gif
    dow 03-08-04 1.gif
    27.7 KB · Views: 346
Hi CM, yes well done Sally for pointing that flag out.

I made a profit today but still made a few mistakes.

I saw the descending triangle forming from the open to about 18:30 (sorry I can't post a chart, I did try but with Esignal I struggle to do snapshots over that long a period of time).

At about 18:30 on my 1 min chart it looked like it had broken the triangle to the upside and I took a long. It bounced back down to the triangle support at around 136 which got me worried then seemed to break out of the triangle to the upside again. It then came back down to 136 yet again.

I realised that maybe I had drawn the triangle resistance line wrong and too late ... the triangle broke downwards so I closed my trade for a 20 point loss and took a short as I knew the triangle target was quite large.

My exit was perfect, at 103 on the first of two brief bounces down to about 100.

With hindsight I think that:

1. I should have expected the triangle to break downwards as it was a descending triangle and more likely to go in that direction. I should have also considered Sally's flag but was struggling to comprehend all that was going on.

2. I shouldn't have been so hasty to go long the moment I thought I saw a break of the triangle resistance line. Plus others were going long on the basis of a 3 pk bump which I thought supported my decision.

3. I should have waited for the pullback to the triangle support line at 136 after the triangle broke, could have collected 10 more points that way.

Coomments welcome ... plus a quick question, when a triangle breaks do you normally get a pullback just as you would when you get a cross of the EMA?

Justyn.
 
Pity you can't post a chart- have you tried pressing "print screen" key and pasting into paint or paint shop pro, and then cropping?
See attached sketch. Triangles often pullback to support just after breakout... either to the horizontal line OR the sloping line,.
I can't see the sloping triangle you mention .... is there one? Did I miss it?
Great exit at 103!
PS- don't wait for the pullback unless you are unsure and want a safe entry. It may just fly.Getting in early means you have to be ruthless if there's a false break and it goes the wrong way. The bonus with getting in early on a false start, is that you are closer to your exit- small comfort as you could have avoided a loss. Only you can decide which to chose.
 

Attachments

  • triangle breaks.gif
    triangle breaks.gif
    3.9 KB · Views: 224
CM,

I've attached the 2 min chart.

In Esignal you need the 3 min chart to see back as far as the start of the triangle all on one page. Without looking at the 1 min chart it is difficult to see where I made the mistake of thinking that the triangle had broken upwards, maybe I should make more use of 2,3 or 5 min charts to confirm what I think I am seeing at the time?

At points A (18:40 GMT) and then point B I though the triangle had broken upwards but was wrong. The wrong resistance line went back to yesterdays peak at 20:44. The correct resistance line seemed to connect with the penultimate peak at 20:34 yesterday.

The horizontal support line for the triangle was at about 136.

Justyn.
 

Attachments

  • chart.gif
    chart.gif
    44.2 KB · Views: 279
OK I think the problem is time scales..... For a valid triangle, it's like all other things- it comes in three's. You're looking for 3 cycles contained within the triangle. There is a triangle from 16:30 to 17:10 that broke to the down side at 17:06. Then it broke back up to 165 , before finally sinking .Your triangle has gone back way too far with all sorts going on inbetween, cancelling its validity as a triangle.Think of it like this.... a bull flag, if it continues for a long time with lots of cycles, becomes a channel.
Draw a line from the topside of that triangle and project it down to 112 at the close. Interesting line!!!
 
Hi CM,

here is the 5 min chart. It looked like a triangle at the time to me.

Line A was the first resistance line which seemed to get broken twice on the 1 min chart at point C.

Line B was the revised resistance line.

Either way, line A does seem to be a resistance line with 4 bounces off it. If this down channel continues today then I estimate the close will be anywhere between 10000 and 10064.

Justyn.
 

Attachments

  • chart.gif
    chart.gif
    11 KB · Views: 239
Hi CM

RS and SR switches don't seem to be mentioned much these days.

I did not get chance to go in the chat room yesterday but I did keep having a look at the chart and I though I saw a RSI SR switch just before 7:00pm. If you look at Justyn's chart [3 posts back] you might see what I mean. The switch is taking place between point A and B.

So I have 2 questions:

1. Is this really an SR switch?
2. If it is, how much notice should I/we take of it. Since this type of TA is not mentioned a lot these days does that mean it is not useful?

TIA

Bill :)
 
Top