DOW - ES Charts 06/01 - 10/01

ChartMan

Legendary member
Messages
5,580
Likes
47
Super day for a buy and hold, and hold and hold. :)
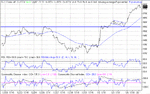
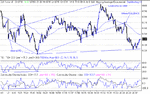
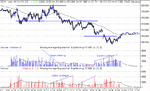
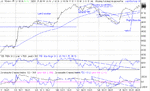
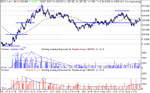
Yesterday's bull flag gave a target of 8800, which we almost made.Sitting well above the 100MA all day and the biggest pullback of 20 points should have netted everyone a nice wad . Unfortunately for the T Time traders, it was all but done, but there was a nice pullback to the 100MA on the 1 min chart, before it's final push to 8800, giving 60 points or so.
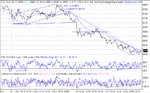
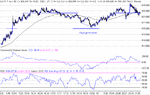
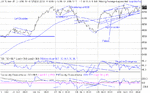
This is one of those days when you think " if only I had put 1% of my pot on this." You'd have made 200%- and been a nervous wreck for the whole day and smoked 50 fags. :) Still even a sensible stake would have returned a handsome wedge.
 

Attachments

  • dow 06-01-03.gif
    dow 06-01-03.gif
    22.1 KB · Views: 461
With a distinct lack of buyers there was only one way to go.The only time the sellers came in was at the end of the session, no doubt to cash in their chips from the day's fleecing.
A steady step up the fives all day, until the double top at the session's end made for an easy day's profit. Is there such a thing? Nice ride up the 100MA too.
 

Attachments

  • es 06-01-03 vol.gif
    es 06-01-03 vol.gif
    21.2 KB · Views: 465
MyTrack data seems to be screwed tonight so no ES charts :(
The Dow spent the day range bound. Conflicting signals suggest a closing "W" bottom, but the bounce off the 100MA confirming the last down trend turnaround could show more downside tomorrow. The key will be action around the 100MA, whether it breaks to the upside, or bounces off the 100MA and continues on down. Key levels 8700/ 8750.
 

Attachments

  • dow 07-01-03.gif
    dow 07-01-03.gif
    23.9 KB · Views: 429
Key level 8750/8700. Overnight gapping down told us the answer, opening at 8680 or so. Nice leasurely short all day to give another easy day's trading.Yesterday's action formed a Bear flag, with a target of 8680. Looking at the chart, that's where it tried to break the 100MA, just failing to go beyond the 100MA+20 rule at 8697.The rest of the day just slid down the 100MA.The Positive divergence in the last two hours could provide upside moves tomorrow. No sign of RS switches though...Looking at the 10 min charts, there is a possibility of a big head and shoulders forming leading to a target of 8400. Keep a look out for the right shoulder developing around 8650. Strong support at 8550 will be key later on.
 

Attachments

  • dow 08-01-03.gif
    dow 08-01-03.gif
    25.2 KB · Views: 382
ES volume chart. Is that Buyers coming in at the end of the day?
 

Attachments

  • es 08-01-03 vol.gif
    es 08-01-03 vol.gif
    21.4 KB · Views: 386
This is developing quite nicely. Yesterday's PD did the Biz and the Head and shoulders( for the moment) has failed. I've pointed this out on the chart. Now we have developed an Inverse Head & Shouders that's bounced near the 100MA. This gives us a target of 8810 or so. This has been the point for the double top or the Head. So this will be the crunch point tomorrow. Break that and we'll be away to 9K. Don't forget that the Inv. H&S has a decision point at 8810. This is where it can fail and turn round. Contrary to text books and popular belief, Inv H&S's are not restricted to appearing at bottoms. They have a target, and a faliure point that will dictate the next move. We can now see an RS switch to support the move up.
 

Attachments

  • dow 09-01-03.gif
    dow 09-01-03.gif
    20.4 KB · Views: 335
ES Chart.......926 top was not dificult to call with the long drop off in CCI and the fact that there was no serious attempt to move above this value.The bottom was an easier call, with the pullback towards the close providing a nasty surprise.
 

Attachments

  • es 09-01-03 vol.gif
    es 09-01-03 vol.gif
    17 KB · Views: 371
What a day! Still, the Inv. H&S target suggested yesterday was spot on at 8810. Strange how these things work out :)
You could have been forgiven for thinking the bottom had fallen out of the move at the open, but watching The ES volume soon told the story. It seems to me that this was nothing but a knee jerk reaction to the news. I guess all the US L2 guys creamed it on the way down as well as on the way up. I hope no - one from here was holding when the news came out. IF you were short, then either a) you were a lucky fool, or b) you made a bad choice that turned good. If you were in you should have been long.
Anyway, the picture is looking even better for the bulls. We have confirmed the delivery of the Inv. H&S and now have a major bull triangle developing. This gives us a target of 9K.
Another clue to the direction is the negative divergence across 2 days. Instead of this turning into a top and falling over, the momentum has been maintained.
Having said all that, we still have to break and maintain 8800 . 8750 looks to be the crunch support point......
 

Attachments

  • dow 10-01-03.gif
    dow 10-01-03.gif
    19.2 KB · Views: 319
ES Vol Chart. Very high volume from the opening. Not easy trading the rise with a 2 point trailing stop.Trading the 00's and 05's with a 1 point stop would have given good results.
 

Attachments

  • es 10-01-03 vol.gif
    es 10-01-03 vol.gif
    23.1 KB · Views: 278
Top