Masterful
Junior member
- Messages
- 48
- Likes
- 0
Didn't see any threads for longer term views on the Dow and wanted to post an interesting 70 week cycle date that fell on Friday.
All views welcomed
-----
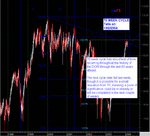
When browsing DOW chart noticed excellent response to a 70-74 week cycle over the last 50+ years on the DOW.
Generally the cycle marks intermediate highs and lows however sometimes can just indicate congestion periods.
NB
74 week cycle also rounds to an 18 month fibonacci cycle (74/4=18).
Have attached a chart.
{Note fib levels which may provide turning points and have done so, the text blocks these out in the attachment.}
:cheesy:


