Just a quick review tonight- been out...
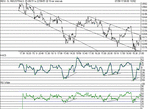
Closed up 107 after a shocker of a start dropping to 136, close to a previous low of some time ago (129).Surprising as I considered yesterday well overdone. After 90 mins of trading though, there was an about turn.This lead to a test of 300 again, and closing down 25 from there at 275.Notice on the 10 min chart attached, the clear positive divergence at the bottoms, signifying a reversal.These are bankable (if you have the confidence to trust in TA). The two indicators are usually available on all chart systems, not just AIQ.These are MACD and RSI (Wilder 14 day). The MACD settings I use are 5,35,5, as opposed to the more usual 12,25,9. These divergences are also visible , to a lesser degree, on 3/5 min charts, and even on 1 min charts, if you look hard enough.....
We're still in the grips of what must now be considered a solid down trend, major breakouts in either direction having been tried,tested and failed.
Is that a solid elliot upwave I see from the bottom at 136?Will it continue?Looks to have more substance than any of the rises over the last 10 days or so...

