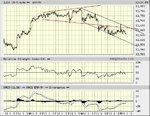
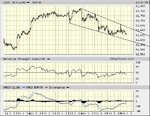
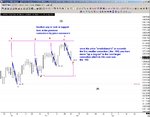
Dow 2007

Bez said:
I would like a pull back to a fib ratio measured from point (8) to point (9) but no lower than point (8)'s low as this was the last Medium delta turn point ( 12337) . If it breaks that it means a high frame is in and I would have to re assess things.

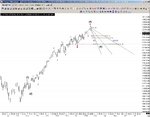
We are due a medium delta point high around this week ...so that INDU EW count would fit very well to have the next Medium delta point low on the 8th+/- of March as a wave 4 low.

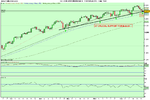
It quite rare to have more than 9 waves on a higher degree daily time frame & the 261.8% extention is a classic wave 3 target so this area (+/- for stops) will catch the eye of the techincal traders now this months buy options expiration is out the way....

Update on the weekend post & a chart to help.... :)
 

Attachments

  • point8&9of 3.jpg
    point8&9of 3.jpg
    195.2 KB · Views: 321
your model is based on optics : incident and outgoing optical angel r equal

thats definitely wrong esp. for the price model for stocks
u can use this but u cant earn anything by applying this model in daytrading

==============================================================
U can stick your chart on the wall, .....
==============================================================
 
Last edited:
You've lost me there ..:)))

Who said anything about daytrading :?: These are just my higher frame doodles.....
 
Last edited:
pssonice said:
thats definitely wrong esp. for the price model for stocks
u can use this but u cant earn anything by applying this model in daytrading

==============================================================
U can stick your chart on the wall, .....
==============================================================
pssonice

you are barking up the wrong tree here mate
Bez does road maps of what he anticipates will happen in the markets
its not a stratergy!!
its an idea, its visual 101
learn to anticipate and eventually you get good at it capiche!!
 
pssonice said:
thats definitely wrong esp. for the price model for stocks
u can use this but u cant earn anything by applying this model in daytrading

==============================================================
U can stick your chart on the wall, .....
==============================================================
pssinthewind,you've responde with vehemence to a few freindly posts here that offer nothing other than hard work,educated guesses,please don't shoot the good samaritans,in this case bez has been very helpful,good luck in your trading,by the way if it sells off hard and theres a cover point for your shorts its usually on some of these numbers ,fridays was 12630 on the dow
 
Hey everyone

As some of you might know I have a short futures trade on so might be guilty of talking my position.

However the chart I have here seems to make the Dow look a straight forward short at this point.

It seems to have broken down a megaphone top to the downside and moved into a downward price channel.

RSI and MACD have crossed lower.

Just for record price is now 12,638 (Bid at CI spreadbet) at 17.28 GMT.

If I wasn't already short I think I would go short now but if it doesn't get 20 or so points lower in the next hour or so look to cover before they burn me again!

They don't like bears on Wall St do they!

Stephen McCreedy
 

Attachments

  • djia.JPG
    djia.JPG
    67.1 KB · Views: 132
an alternative support line kicking in around 12600?

Stephen McCreedy
 

Attachments

  • djia.JPG
    djia.JPG
    66.1 KB · Views: 151
smccreedy said:
Hey everyone

As some of you might know I have a short futures trade on so might be guilty of talking my position.

However the chart I have here seems to make the Dow look a straight forward short at this point.

It seems to have broken down a megaphone top to the downside and moved into a downward price channel.

RSI and MACD have crossed lower.

Just for record price is now 12,638 (Bid at CI spreadbet) at 17.28 GMT.

If I wasn't already short I think I would go short now but if it doesn't get 20 or so points lower in the next hour or so look to cover before they burn me again!

They don't like bears on Wall St do they!

Stephen McCreedy

Nice one mccreedy :) I shorted this one straight from the opening as we plunged immediately I got nicely. I've exited most of my position already around 12650 and looks like a potential selling climax at 12625 now... (btw, I don't hold overnights)
 
Looks like it's now or never for the bulls.. a break through the trendline since DEC should give a decent correction (see chart)..or if bullish a BUY here with at tight stop...
 

Attachments

  • DOW JONES INDUSTRIAL A.png
    DOW JONES INDUSTRIAL A.png
    19.1 KB · Views: 149
I got a similar chart too on Friday … I estimated a turnaround at 12622 back upwards to 12823 max …. trend permitting …
This is purely speculation of course … and it’s the first time my chart has looked like someone elses, cool
 

Attachments

  • Dow 20070123.JPG
    Dow 20070123.JPG
    94.4 KB · Views: 153
Oh yes, also ..... if the dow goes as far south as my 12599 line, I was wrong :cry:
 
here same chart on a shorter time scale....
 

Attachments

  • DOW JONES INDUSTRIAL30 mins A.png
    DOW JONES INDUSTRIAL30 mins A.png
    36 KB · Views: 180
catracho said:
Looks like it's now or never for the bulls.. a break through the trendline since DEC should give a decent correction (see chart)..or if bullish a BUY here with at tight stop...[/QUOTE

I agree with that one Catracho, seems to me that 12580 is more key to the current price action? If that breaks, we are on the way to 12500 minimum!
Alternatively, a break thru 12640 takes us north. Well, thats my '2 pence worth'. :confused:
For what it's worth, I favour the former! But what do I know?

cheers - Tricks
 
catracho said:
here same chart on a shorter time scale....

looks like it's holding right where I should... (also 30-min chart)
 

Attachments

  • YM_30minchart.png
    YM_30minchart.png
    23.9 KB · Views: 164
Another way at looking at dynamic support points....:)
 

Attachments

  • save.jpg
    save.jpg
    210.4 KB · Views: 148
outside down on the daily!
the trend is still down would like to see it 12560 area then re evaluate
 
Bez said:
Another way at looking at dynamic support points....:)

Bez,

Doe's that imply it's going up or down? Can't quite work out what you mean with the price correction movements, as stated? Your analysis is quite obviously very astute, and your knowledge of EW is way above my understanding. :eek: What are your immediate target figures? I'm short on March contract and bleeding!

cheers - Tricks
 
The chart just shows dynamic pressure points technical traders will look to...

On the bigger picture the delta is down, we may get some mischief tomorrow morning as were due a lesser delta point, but I still have the higher frames (trend) down ..
 
Bez said:
The chart just shows dynamic pressure points technical traders will look to...

On the bigger picture the delta is down, we may get some mischief tomorrow morning as were due a lesser delta point, but I still have the higher frames (trend) down ..

Thanks Bez
 
Top