Dow 2007

Bez said:
Hi Tricks,

It has been to quiet on here lately....

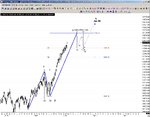
The INDU hit its 261.8% target so i wouldn't be surprised if we get a pull back from here...Time wise I would of liked the 23rd as a hit but the 16th also gets some triangle hits..(16, 26,42)

This is my alt bull count that keeps niggling me, which give the 8th of March as a low ...

Hi Bez,
Thanks for your response. I just wish I could understand EW analysis more than I do. I can grasp the basic principles of the number of waves, but 'where' to start and finish drawing them, is, I'm afraid, way beyond me. I guess you start from 'point A' and draw the lines in relation to fib numbers. But, on the chart of the INDU do you see a pullback to 12338 as the next wave, and, would I be right in saying, that wave 3 could still extend anyway? As I write, the futures are up 22 points again.

cheers - Tricks
 
It can be hard a first to get a grasp on the waves and which degrees to lable but it comes easier after time. I've lost count (no pun int :) how many times i've thumbed through Prechter's books over the years to double check counts.

I would like a pull back to a fib ratio measured from point (8) to point (9) but no lower than point (8)'s low as this was the last Medium delta turn point ( 12337) . If it breaks that it means a high frame is in and I would have to re assess things.

We are due a medium delta point high around this week ...so that INDU EW count would fit very well to have the next Medium delta point low on the 8th+/- of March as a wave 4 low.

It quite rare to have more than 9 waves on a higher degree daily time frame & the 261.8% extention is a classic wave 3 target so this area (+/- for stops) will catch the eye of the techincal traders now this months buy options expiration is out the way....

But I'm just an intraday trader, I only look at the higher time frames as a gray matter exercise just to get a basic idea of directional pressure. :eek:
 
Bez said:
It can be hard a first to get a grasp on the waves and which degrees to lable but it comes easier after time. I've lost count (no pun int :) how many times i've thumbed through Prechter's books over the years to double check counts.

I would like a pull back to a fib ratio measured from point (8) to point (9) but no lower than point (8)'s low as this was the last Medium delta turn point ( 12337) . If it breaks that it means a high frame is in and I would have to re assess things.

We are due a medium delta point high around this week ...so that INDU EW count would fit very well to have the next Medium delta point low on the 8th+/- of March as a wave 4 low.

It quite rare to have more than 9 waves on a higher degree daily time frame & the 261.8% extention is a classic wave 3 target so this area (+/- for stops) will catch the eye of the techincal traders now this months buy options expiration is out the way....

But I'm just an intraday trader, I only look at the higher time frames as a gray matter exercise just to get a basic idea of directional pressure. :eek:

I'd have to say that no matter how many times I read your posts, I never really know whether you're saying the outlook is bullish or bearish...(not meant aggressively!) but I guess that's cos I'm not in the least bit EW'ed up!

So what is EW telling you at the moment...in 'non-EW speak' for others like me!
 
In simple terms I'm bullish till at least 25th of May when this move from the July lows should take a rest for a while...:)

This is why ...

Higher frame INDU fitted to the Long term Delta...
 

Attachments

  • INDU doodle.jpg
    INDU doodle.jpg
    201.3 KB · Views: 202
Last edited:
The intraday delta odds (67%) favour a lunch time high then down into the last hour ...

:?:
 
Serious support around the 12730 area, this needs to be broken for a move to 12650.
 
I'd say yes to your target, but I guess it depends which way its' going to break out of the converging trendlines.....
 

Attachments

  • DOW.jpg
    DOW.jpg
    156.1 KB · Views: 169
Slapshot said:
I'd say yes to your target, but I guess it depends which way its' going to break out of the converging trendlines.....

Depends on the PPT, given today's data release! But the current liquidity cannot be ignored either.

But, maybe thats being too cynical. :?:

cheers - Tricks
 
firewalker99 said:
Looks like it needs some kind of catalyst to break that support :(

Edit: as we speak... :D


Catalyst - Well we have Iran causing a bit of a fuss.. will it lead to anything?
 
The_Prophet said:
Catalyst - Well we have Iran causing a bit of a fuss.. will it lead to anything?

If it does it will be pretty obvious since we are well above last weeks lows around 23/24 higher than lows for spx
 
I mentioned 12650 as a support area yesterday and the bounce is clear to see, now it's got to get above the 12680 area to head north again
 
Top